EXHIBIT 99.1
Innovation in Aggregation We Build, Buy & Scale Amazon And eCommerce Brands February 2023 Investor Presentation NASDAQ: UPXI
This presentation contains “forward-looking statements”, including statements regarding Grove, Inc. and its subsidiaries, within the meaning of the “safe harbor” provisions of the Private Securities Litigation Reform Act of 1995. All of the statements in this presentation, including financial projections, whether written or oral, that refer to expected or anticipated future actions and results of Grove are forward-looking statements. In addition, any statements that refer to expectations, projections, or other characterizations of future events or circumstances are forward-looking statements. These forward-looking statements reflect our current projections and expectations about future events as of the date of this presentation. Grove cannot give any assurance that such forward-looking statements and financial projections will prove to be correct. The information provided in this presentation does not identify or include any risk or exposures, of Grove that would materially adversely affect the performance or risk of the company. By their nature, forward-looking statements and financial projections involve numerous assumptions, known and unknown risks and uncertainties, both general and specific, that contribute to the possibility that the predictions, forecasts, projections and other forward-looking information will not occur, which may cause the Company's actual performance and financial results in future periods to differ materially from any estimates or projections of future performance or results expressed or implied by such forward-looking statements and financial projections. Important factors that could cause actual results to differ materially from expectations include, but are not limited to: business, economic and capital market conditions; the heavily regulated industry in which Grove carries on business; current or future laws or regulations and new interpretations of existing laws or regulations; legal and regulatory requirements; market conditions and the demand and pricing for our products; our relationships with our customers and business partners; our ability to successfully define, design and release new products in a timely manner that meet our customers' needs; our ability to attract, retain and motivate qualified personnel; competition in our industry; failure of counterparties to perform their contractual obligations; systems, networks, telecommunications or service disruptions or failures or cyber-attack; ability to obtain additional financing on reasonable terms or at all; litigation costs and outcomes; our ability to successfully maintain and enforce our intellectual property rights and defend third party claims of infringement of their intellectual property rights; and our ability to manage our growth. Readers are cautioned that this list of factors should not be construed as exhaustive. All information contained in this presentation is provided as of the date of the presentation and is subject to change without notice. Neither Grove, nor any other person undertakes any obligation to update or revise publicly any of the forward-looking statements and financial projections set out herein, whether as a result of new information, future events or otherwise, except as required by law. This is presented as a source of information and not an investment recommendation. This presentation does not take into account nor does it provide any tax, legal or investment advice or opinion regarding the specific investment objectives or financial situation of any person. Grove reserves the right to amend or replace the information contained herein, in part or entirely, at any time, and undertakes no obligation to provide the recipient with access to the amended information or to notify the recipient thereof. Use of Non-GAAP Financial Measures The Company discloses and uses the above-mentioned non-GAAP financial measures internally as a supplement to GAAP financial information to evaluate its operating performance, for financial planning purposes, to establish operational goals, for compensation plans, to measure debt service capability, for capital expenditure planning and to determine working capital needs and believes that these are useful financial measures also used by investors. Non-GAAP adjusted EBITDA is defined as GAAP net income or net loss before interest, taxes, depreciation and amortization (EBITDA) adjusted for the non-cash stock compensation and stock option expense, acquisition, integration & restructuring expenses, charges and gains or losses from extinguishment of debt and other non-cash items. Non-GAAP EBITDA and non-GAAP adjusted EBITDA are not terms defined by GAAP and, as a result, the Company’s measure of non-GAAP EBITDA and non-GAAP adjusted EBITDA might not be comparable to similarly titled measures used by other companies. Generally, a non-GAAP financial measure is a numerical measure of a company’s performance, financial position, or cash flow that either excludes or includes amounts that are not normally included in the most directly comparable measure calculated and presented in accordance with GAAP. The non-GAAP financial measures discussed above, however, should be considered in addition to, and not as a substitute for, or superior to net income or net loss as reported for GAAP on the Consolidated Statements of Operations, cash and cash flows on the Consolidated Statement of Cash Flows or other measures of financial performance prepared in accordance with GAAP, and as reflected on the Company’s financial statements prepared in accordance with GAAP. These non-GAAP financial measures are not a substitute for or presented in lieu of financial measures provided by GAAP and all measures and disclosures of financial information pursuant to GAAP should be read to obtain a comprehensive and thorough understanding of the Company’s financial results. The reconciliations of non-GAAP EBITDA and non-GAAP adjusted EBITDA to GAAP operating income (loss) and/or GAAP net income (net loss) referred to in the highlights or elsewhere are provided in the schedules that are a part of this document. Forward Looking Information 2
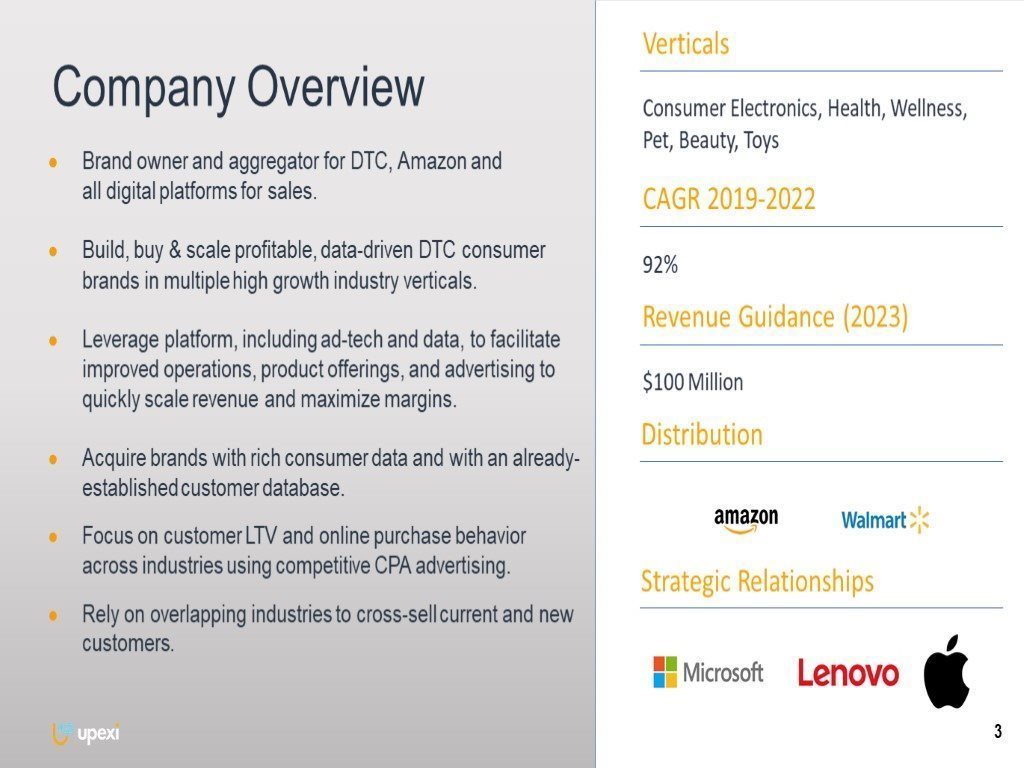
Company Overview Brand owner and aggregator for DTC, Amazon and all digital platforms for sales. Build, buy & scale profitable, data-driven DTC consumer brands in multiple high growth industry verticals. Leverage platform, including ad-tech and data, to facilitate improved operations, product offerings, and advertising to quickly scale revenue and maximize margins. Acquire brands with rich consumer data and with an already-established customer database. Focus on customer LTV and online purchase behavior across industries using competitive CPA advertising. Rely on overlapping industries to cross-sell current and new customers. Verticals CAGR 2019-2022 Revenue Guidance (2023) Consumer Electronics, Health, Wellness, Pet, Beauty, Toys 92% $100 Million Distribution 3 Strategic Relationships
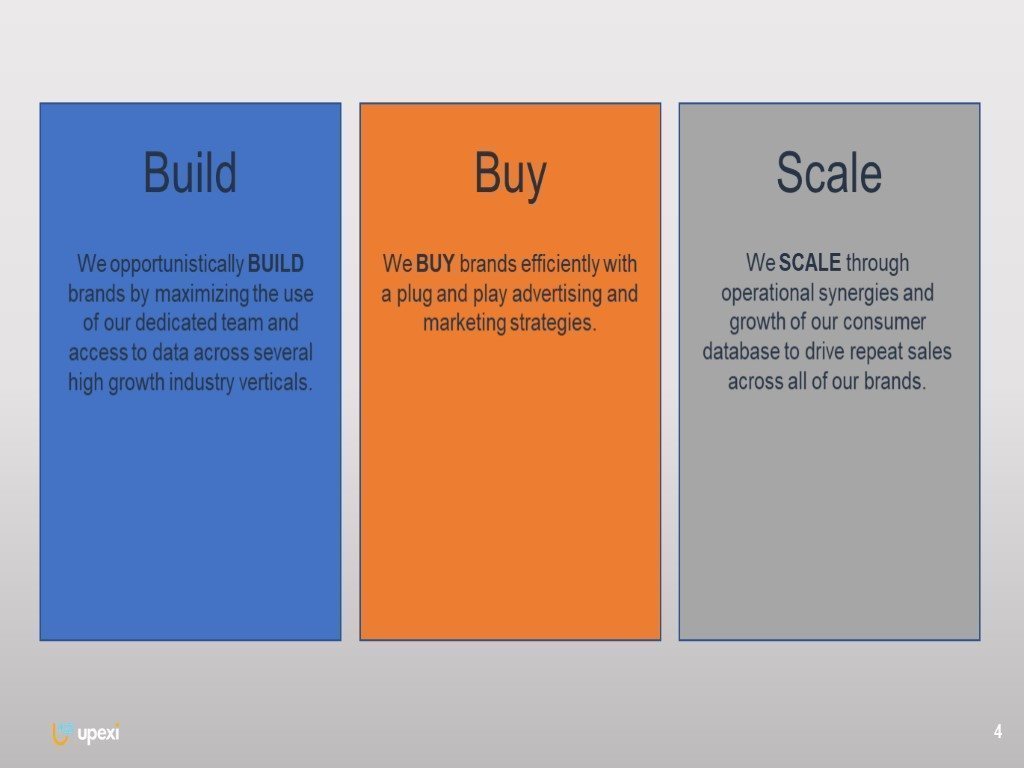
4 Buy Build Scale We opportunistically BUILD brands by maximizing the use of our dedicated team and access to data across several high growth industry verticals. We BUY brands efficiently with a plug and play advertising and marketing strategies. We SCALE through operational synergies and growth of our consumer database to drive repeat sales across all of our brands.
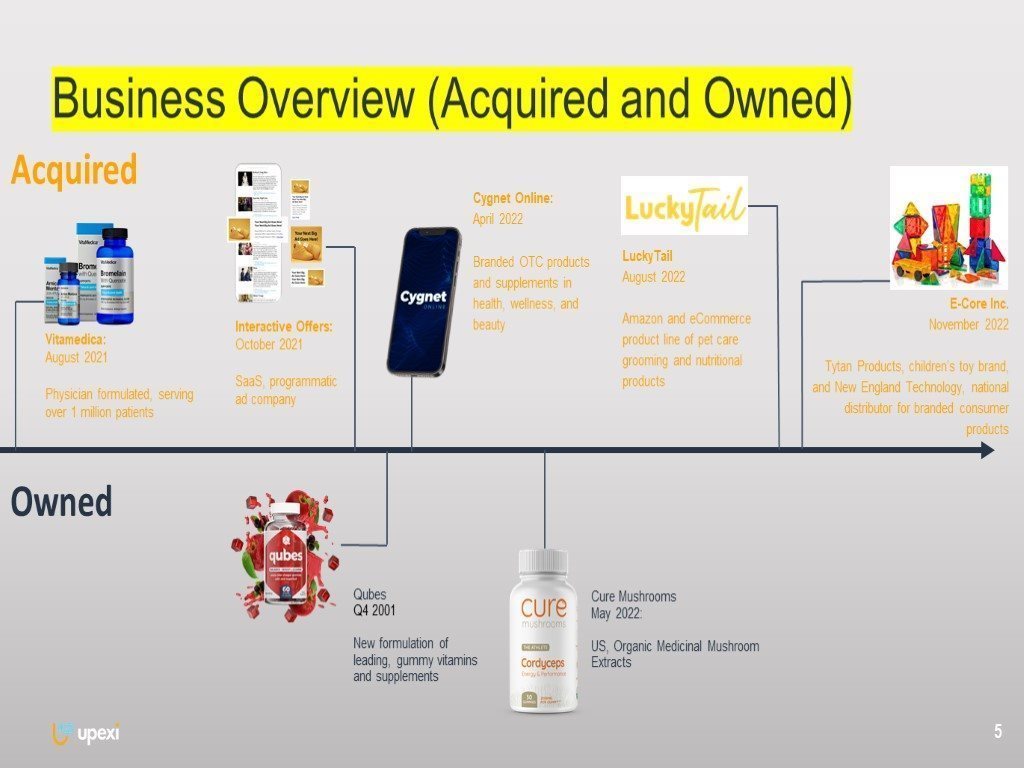
Business Overview (Acquired and Owned) 5 Vitamedica: August 2021 Physician formulated, serving over 1 million patients Interactive Offers: October 2021 SaaS, programmatic ad company Cygnet Online: April 2022 Branded OTC products and supplements in health, wellness, and beauty LuckyTail August 2022 Amazon and eCommerce product line of pet care grooming and nutritional products Cure Mushrooms May 2022: US, Organic Medicinal Mushroom Extracts Acquired Owned E-Core Inc. November 2022 Tytan Products, children’s toy brand, and New England Technology, national distributor for branded consumer products
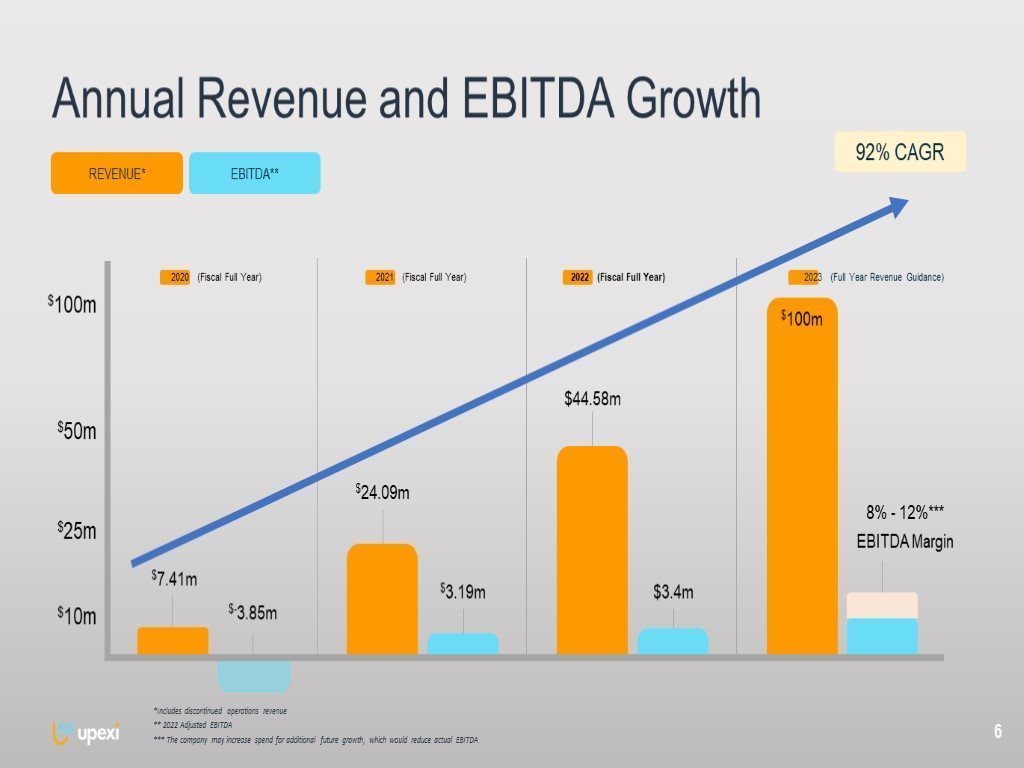
2021 (Fiscal Full Year) 2020 (Fiscal Full Year) Annual Revenue and EBITDA Growth 6 $10m $25m $50m 2022 (Fiscal Full Year) 2023 (Full Year Revenue Guidance) $7.41m $-3.85m $24.09m $3.19m 8% - 12%*** EBITDA Margin $44.58m $3.4m REVENUE* EBITDA** $100m 92% CAGR $100m *Includes discontinued operations revenue ** 2022 Adjusted EBITDA *** The company may increase spend for additional future growth, which would reduce actual EBITDA
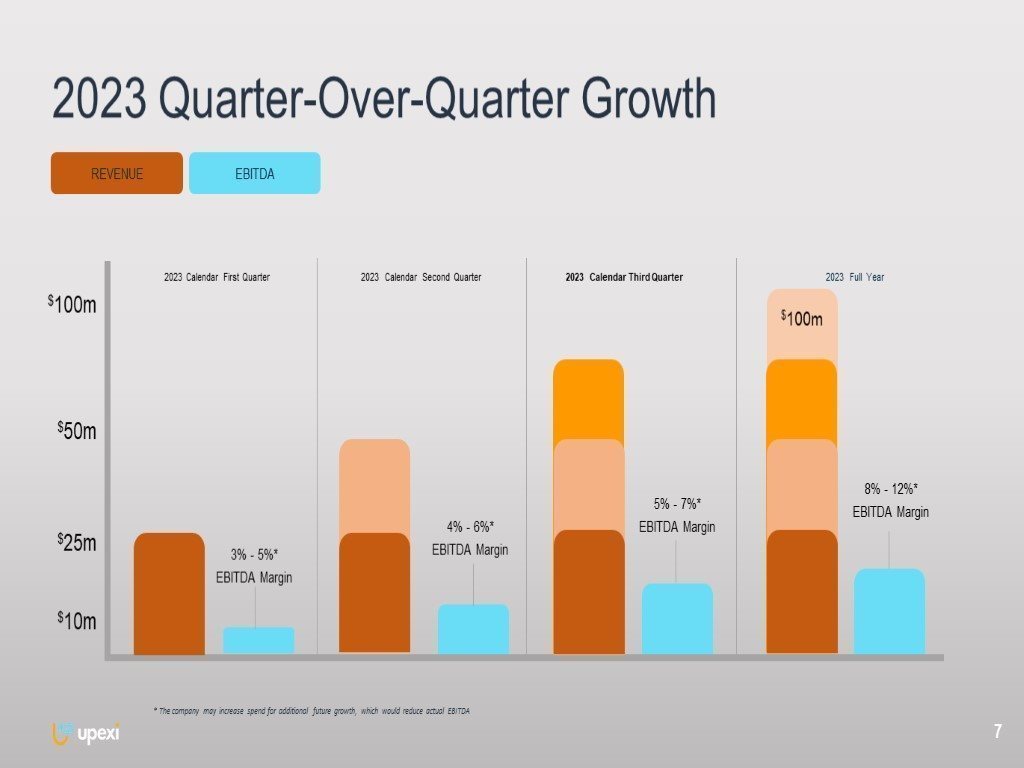
2023 Calendar Second Quarter 2023 Calendar First Quarter 2023 Quarter-Over-Quarter Growth 7 $10m $25m $50m 2023 Calendar Third Quarter 2023 Full Year 8% - 12%* EBITDA Margin REVENUE EBITDA $100m $100m * The company may increase spend for additional future growth, which would reduce actual EBITDA 3% - 5%* EBITDA Margin 4% - 6%* EBITDA Margin 5% - 7%* EBITDA Margin
Proprietary Technology & Data Platform 8 Platform focuses on building a high growth portfolio of patents for single click-to-opt-in technology via Interactive Offers business segment. Success to date is rooted in our technology and data. Implement in-house SaaS platform ad-tech into all of our brand marketing to achieve lower cost per acquisition. Own significant amount of consumer data, allowing us to increase cross-selling between our growth portfolio of brands.
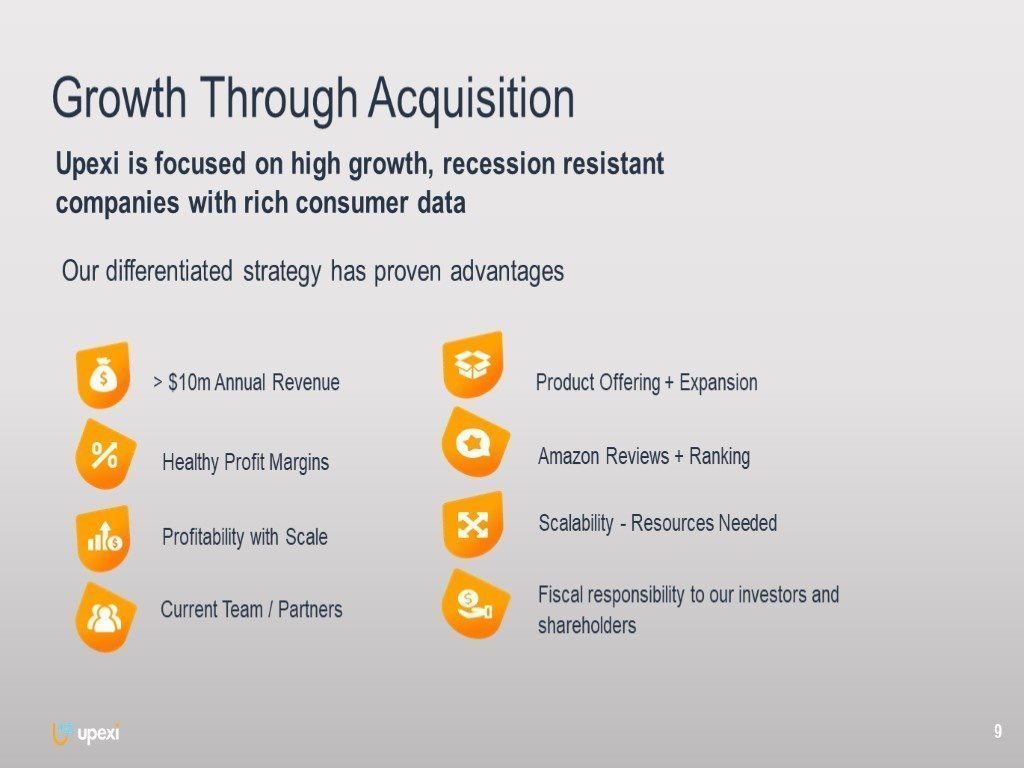
TBD TBD Growth Through Acquisition * 9 months ended March 31, 2021 over 9 months ended March 31, 2020. TBD 9 Upexi is focused on high growth, recession resistant companies with rich consumer data Our differentiated strategy has proven advantages > $10m Annual Revenue Product Offering + Expansion Amazon Reviews + Ranking Scalability - Resources Needed Healthy Profit Margins Profitability with Scale Current Team / Partners Fiscal responsibility to our investors and shareholders
10 Acquisition Criteria & Process Streamlined deal process (we aim for 30 days or less to agree on terms) Seek to retain management for continued upside Target brand acquisitions with an established customer database for cross marketing opportunities Acquisitions with multiples that drive growth at sensible costs Rely on overlapping industries to cross-sell current and new customers In-house brand launches to drive growth with higher margins
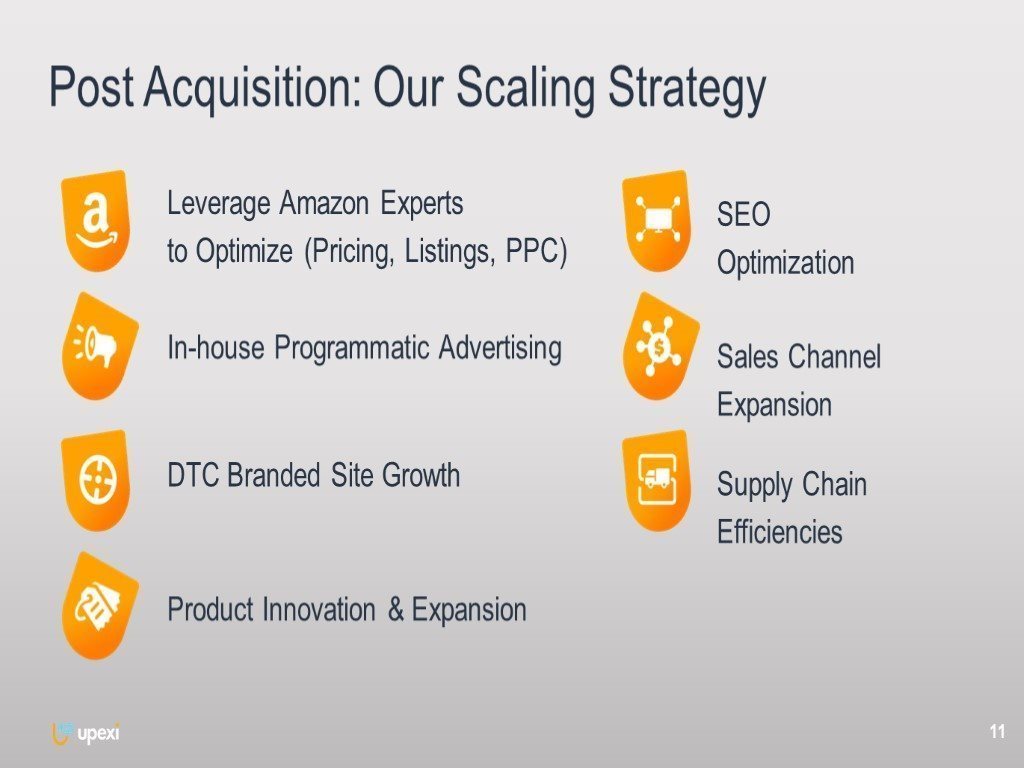
Post Acquisition: Our Scaling Strategy 11 Leverage Amazon Experts to Optimize (Pricing, Listings, PPC) SEO Optimization Sales Channel Expansion Supply Chain Efficiencies In-house Programmatic Advertising DTC Branded Site Growth Product Innovation & Expansion
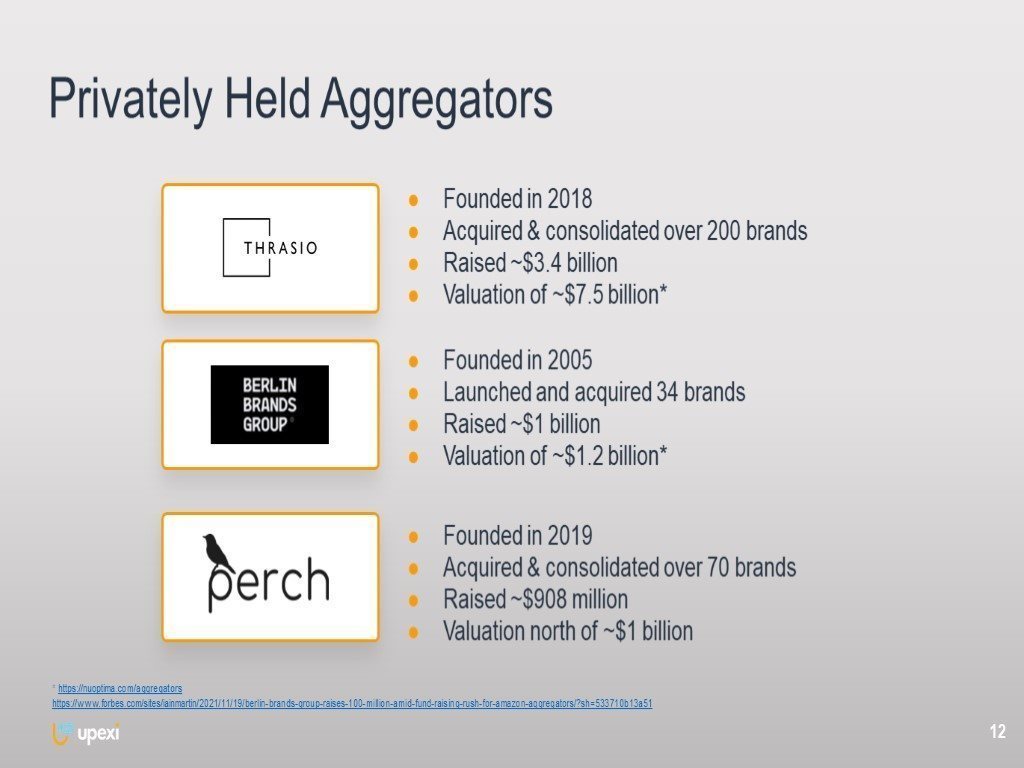
Privately Held Aggregators Founded in 2018 Acquired & consolidated over 200 brands Raised ~$3.4 billion Valuation of ~$7.5 billion* * https://nuoptima.com/aggregators https://www.forbes.com/sites/iainmartin/2021/11/19/berlin-brands-group-raises-100-million-amid-fund-raising-rush-for-amazon-aggregators/?sh=533710b13a51 Founded in 2005 Launched and acquired 34 brands Raised ~$1 billion Valuation of ~$1.2 billion* 12 Founded in 2019 Acquired & consolidated over 70 brands Raised ~$908 million Valuation north of ~$1 billion
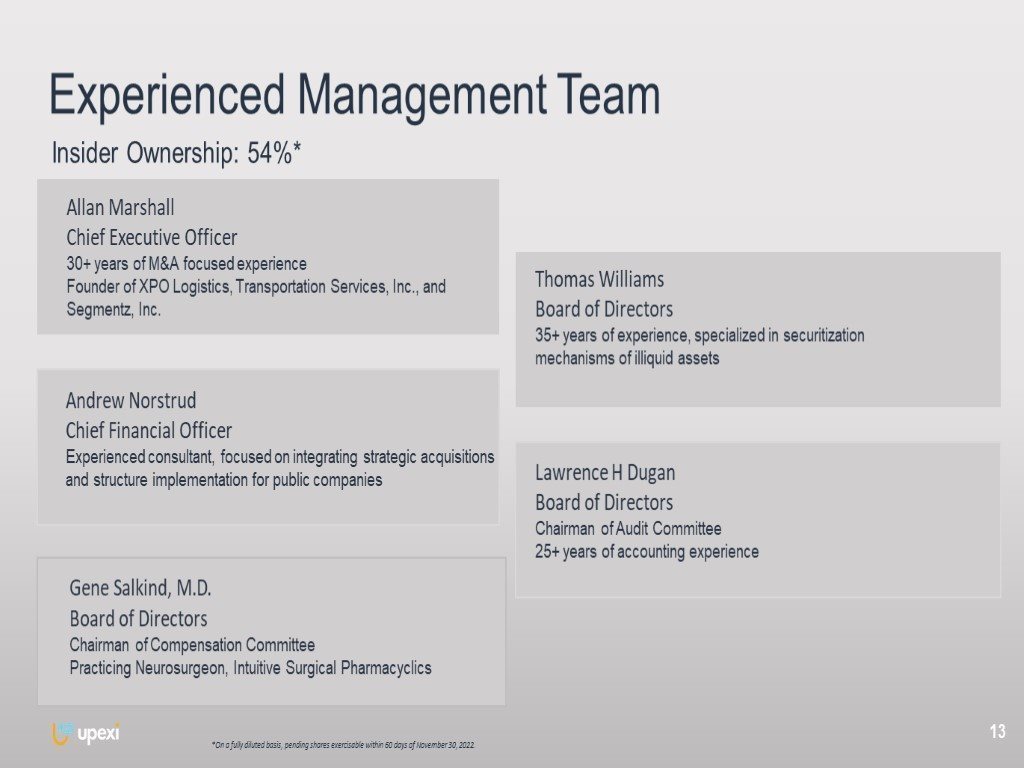
Experienced Management Team 13 Allan Marshall Chief Executive Officer 30+ years of M&A focused experience Founder of XPO Logistics, Transportation Services, Inc., and Segmentz, Inc. Andrew Norstrud Chief Financial Officer Experienced consultant, focused on integrating strategic acquisitions and structure implementation for public companies Gene Salkind, M.D. Board of Directors Chairman of Compensation Committee Practicing Neurosurgeon, Intuitive Surgical Pharmacyclics Thomas Williams Board of Directors 35+ years of experience, specialized in securitization mechanisms of illiquid assets Lawrence H Dugan Board of Directors Chairman of Audit Committee 25+ years of accounting experience Insider Ownership: 54%* *On a fully diluted basis, pending shares exercisable within 60 days of November 30, 2022.
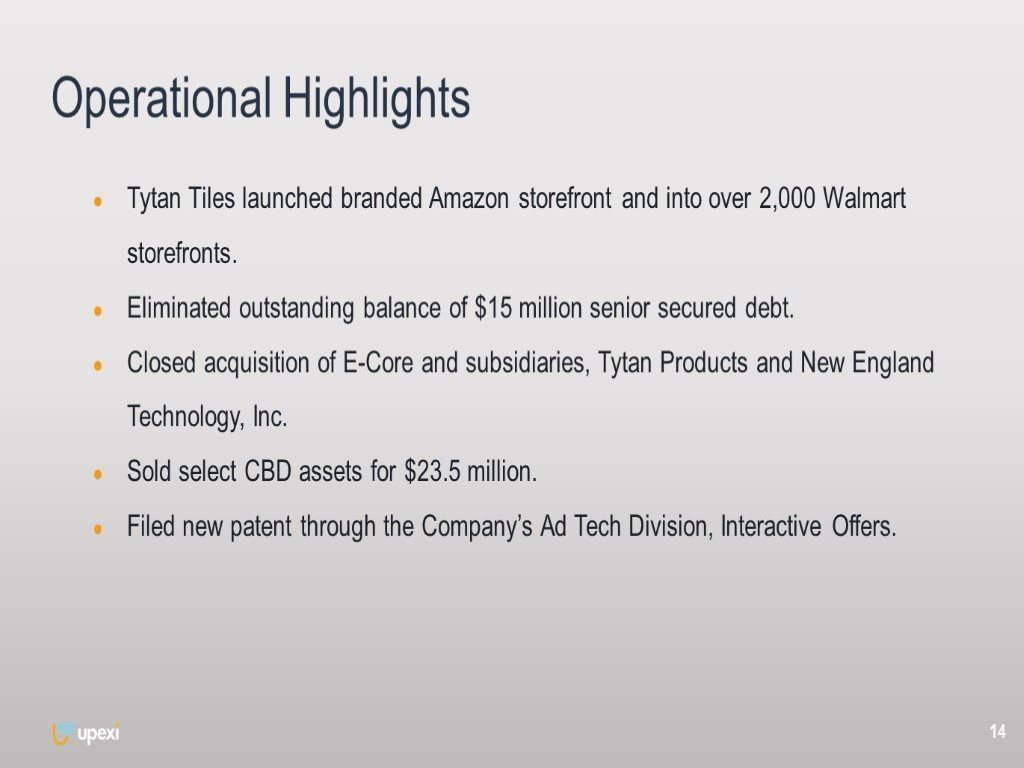
14 Operational Highlights Tytan Tiles launched branded Amazon storefront and into over 2,000 Walmart storefronts. Eliminated outstanding balance of $15 million senior secured debt. Closed acquisition of E-Core and subsidiaries, Tytan Products and New England Technology, Inc. Sold select CBD assets for $23.5 million. Filed new patent through the Company’s Ad Tech Division, Interactive Offers.
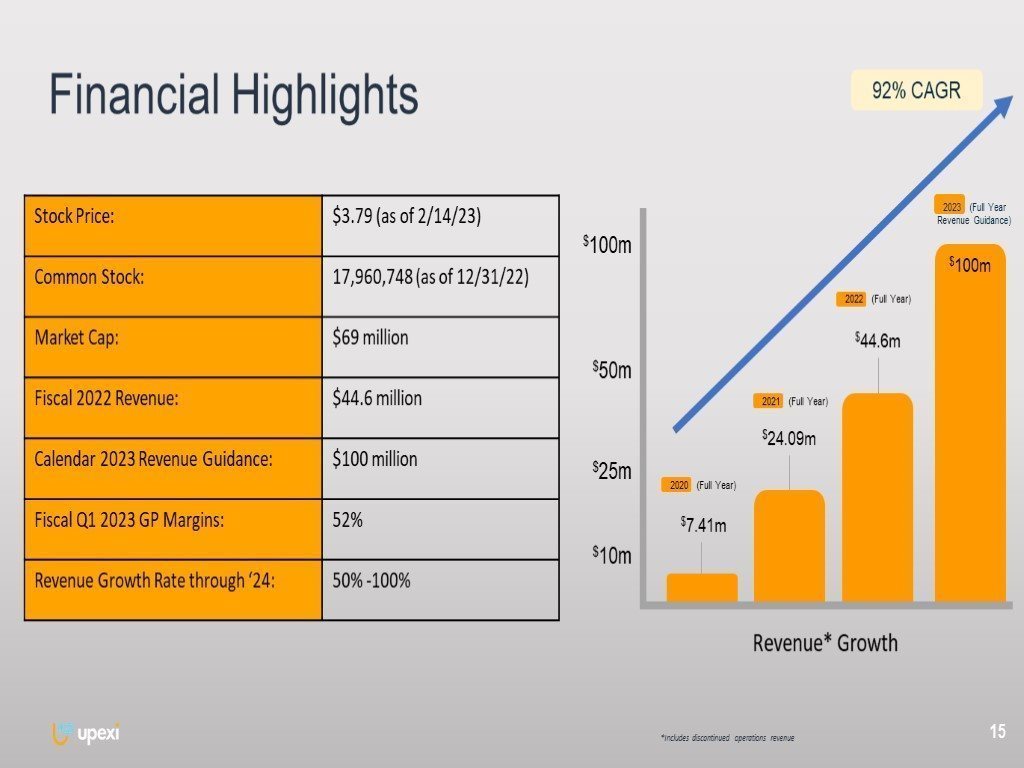
Financial Highlights 15 $10m $25m $50m $100m $7.41m $24.09m $44.6m $100m 2021 (Full Year) 2022 (Full Year) 2023 (Full Year Revenue Guidance) 2020 (Full Year) 92% CAGR Revenue* Growth *Includes discontinued operations revenue
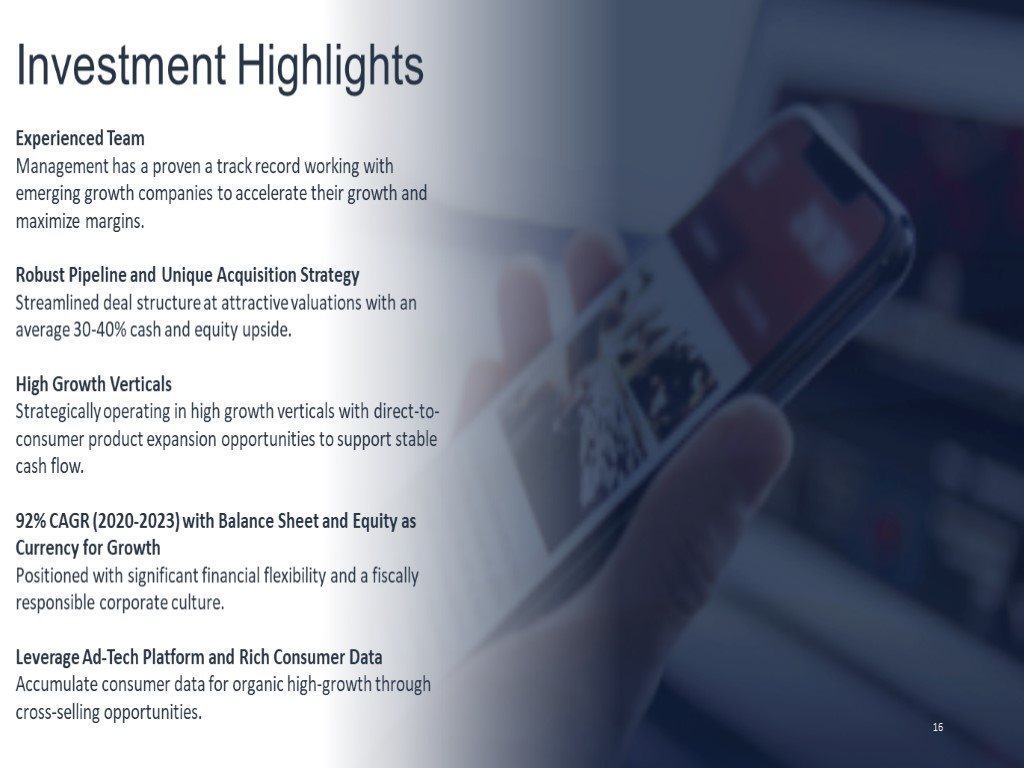
16 Experienced Team Management has a proven a track record working with emerging growth companies to accelerate their growth and maximize margins. Robust Pipeline and Unique Acquisition Strategy Streamlined deal structure at attractive valuations with an average 30-40% cash and equity upside. High Growth Verticals Strategically operating in high growth verticals with direct-to-consumer product expansion opportunities to support stable cash flow. 92% CAGR (2020-2023) with Balance Sheet and Equity as Currency for Growth Positioned with significant financial flexibility and a fiscally responsible corporate culture. Leverage Ad-Tech Platform and Rich Consumer Data Accumulate consumer data for organic high-growth through cross-selling opportunities. Investment Highlights
Thank You 17 Contact Us: upexi@kcsa.com
Appendix February 2023 Investor Presentation NASDAQ: UPXI
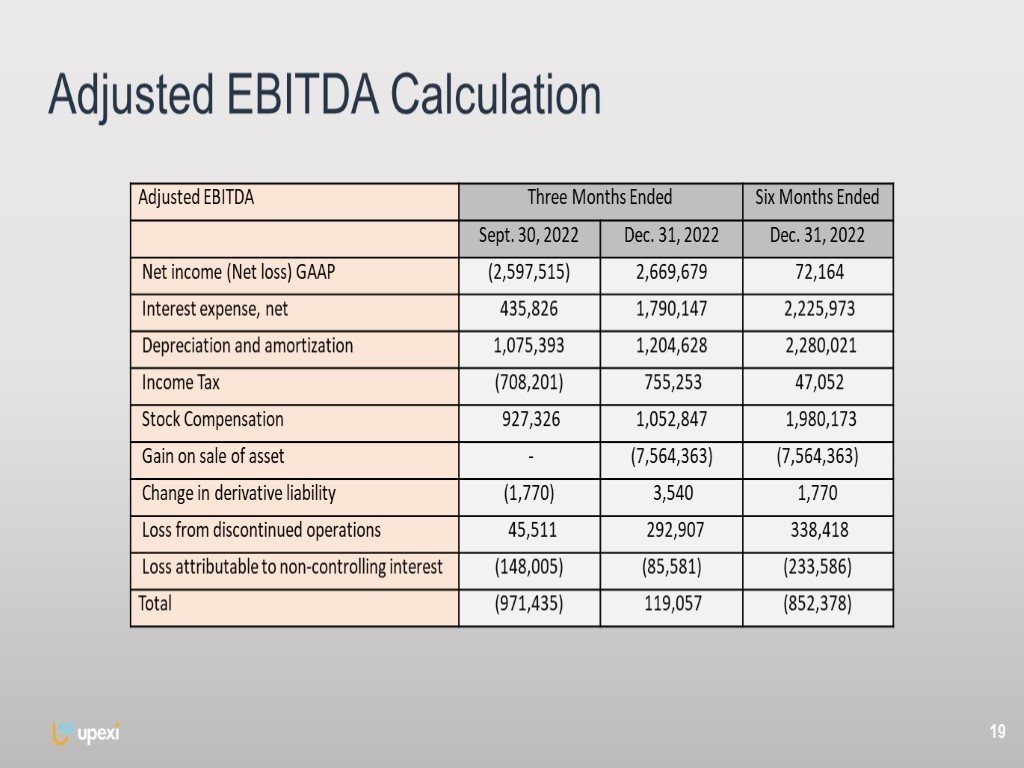
Adjusted EBITDA Calculation 19