UNITED STATES
SECURITIES AND EXCHANGE COMMISSION
Washington, D.C. 20549
FORM 10-K
(Mark One)
| ☒ | ANNUAL REPORT PURSUANT TO SECTION 13 OR 15(d) OF THE SECURITIES EXCHANGE ACT OF 1934 |
|
|
|
| For the fiscal year ended June 30, 2021 | |
|
|
|
| ☐ | TRANSITION REPORT UNDER SECTION 13 OR 15(d) OF THE SECURITIES EXCHANGE ACT OF 1934 |
|
|
|
| For the transition period from ___________ to ____________ | |
|
|
|
| Commission file number 333-255266 | |
| GROVE, INC. |
| (Exact name of registrant as specified in its charter) |
| Nevada |
| 83-3378978 |
| (State or other jurisdiction of incorporation or organization) |
| (I.R.S. Employer Identification No.) |
| 1710 Whitney Mesa Drive Henderson, NV |
| 89014 |
| (Address of principal executive offices) |
| (Zip Code) |
|
|
|
|
| Registrant’s telephone number, including area code: (701) 353-5425 | ||
Securities registered pursuant to Section 12(b) of the Act:
| Title of each class | Trading Symbol(s) | Name of each exchange on which registered |
| None |
|
|
Securities registered pursuant to Section 12(g) of the Act: Common Stock, par value $0.001
| Indicate by check mark if the registrant is a well-known seasoned issuer, as defined in Rule 405 the Securities Act. Yes ☐ No ☒ |
|
|
| Indicate by check mark if the registrant is not required to file reports pursuant to Section 13 or Section 15(d) of the Act Yes ☐ No ☒ |
|
|
| Indicate by check mark whether the registrant: (1) has filed all reports required to be filed by Section 13 or 15(d) of the Securities Exchange Act of 1934 during the preceding 12 months (or for such shorter period that the registrant was required to file such reports) and (2) has been subject to such filing requirements for the last 90 days. Yes ☒ No ☐ |
|
|
| Indicate by check mark whether the registrant has submitted electronically every Interactive Data File required to be submitted pursuant to Rule 405 of Regulation S-T (§ 232.405 of this chapter) during the preceding 12 months (or for such shorter period that the registrant was required to submit such files). Yes ☒ No ☐ |
|
|
| Indicate by check mark whether the registrant is a large accelerated filer, an accelerated filer, a non-accelerated filer, smaller reporting company, or an emerging growth company. See the definitions of “large accelerated filer,” “accelerated filer,” “smaller reporting company,” and “emerging growth company” in Rule 12b-2 of the Exchange Act. |
| Large accelerated filer | ☐ | Accelerated filer | ☐ |
| Non-accelerated filer | ☒ | Smaller reporting company | ☒ |
|
|
| Emerging growth company | ☒ |
If an emerging growth company, indicate by check mark if the registrant has elected not to use the extended transition period for complying with any new or revised financial accounting standards provided pursuant to Section 13(a) of the Exchange Act. ☒
Indicate by check mark whether the registrant is a shell company (as defined in Rule 12b-2 of the Exchange Act). ☐ Yes ☒ No
APPLICABLE ONLY TO CORPORATE ISSUERS
The aggregate market value of Common Stock held by non-affiliates of the Registrant on December 31, 2020, was approximately $17,789,000 based on a $5.00 price paid for such common equity, as of the last business day of the registrant’s most recently completed second fiscal quarter.
Indicate the number of shares outstanding of each of the registrant’s classes of common stock as of the latest practicable date.
15,711,339 common shares as of September 27, 2021.
DOCUMENTS INCORPORATED BY REFERENCE
None.
| 2 |
Forward-Looking Statements
This annual report contains forward-looking statements. These statements relate to future events or our future financial performance. In some cases, you can identify forward-looking statements by terminology such as “may”, “should”, “expects”, “plans”, “anticipates”, “believes”, “estimates”, “predicts”, “potential” or “continue” or the negative of these terms or other comparable terminology. These statements are only predictions and involve known and unknown risks, uncertainties and other factors, including the risks in the section entitled “Risk Factors” that may cause our or our industry’s actual results, levels of activity, performance or achievements to be materially different from any future results, levels of activity, performance or achievements expressed or implied by these forward-looking statements.
Although we believe that the expectations reflected in the forward-looking statements are reasonable, we cannot guarantee future results, levels of activity, performance or achievements. Except as required by applicable law, including the securities laws of the United States, we do not intend to update any of the forward-looking statements to conform these statements to actual results.
| 3 |
| Table of Contents |
General Overview
As used in this current report and unless otherwise indicated, the terms “we”, “us” and “our” mean Grove, Inc., unless otherwise indicated.
We are in the business of developing, producing, marketing, and selling raw materials, white label products and end consumer products containing the hemp plant extract, Cannabidiol (“CBD”). We sell to numerous consumer markets including the nutraceutical, beauty care, pet care and functional food sectors. We seek to take advantage of an emerging worldwide trend to re-energize the production of industrial hemp and to foster its many uses for consumers. In addition, with the close of the acquisition of VitaMedica on August 1, 2021 we are expanding our product offerings beyond only products containing hemp plant extract.
In addition, we are an operator of an annual tradeshow in the United States related to the CBD industry. The Company only has one trade show, CBD.IO, which is held in November each year. Because event revenue is recognized when a particular event is held, the Company experiences fluctuations in quarterly revenue based on the completion of the trade show event.
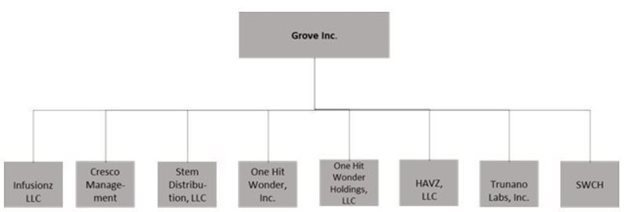
Grove Inc. (the “Company”) is a Nevada Corporation and has eight wholly owned subsidiaries, Trunano Labs, Inc., a Nevada corporation, Cresco Management, a California corporation, Steam Distribution, LLC, a California limited liability company; One Hit Wonder, Inc., a California corporation; Havz, LLC, d/b/a Steam Wholesale, a California limited liability company, and One Hit Wonder Holdings, LLC a California corporation, Infusionz LLC, a Colorado corporation and SWCH, a Delaware corporation.
On July 1, 2020, the noncontrolling shareholders of the Company’s subsidiary, Trunano Labs Inc., converted 1,761,261 shares of Trunano Labs, Inc. stock, representing all the outstanding stock held by minority interest holders, into 1,277,778 shares of Grove Inc. common stock, 10.8% of the then outstanding shares. As of July 1, 2020, Trunano Labs, Inc. is a wholly owned subsidiary of Grove Inc.
On July 1, 2020, the Company entered into an Agreement and Plan of Merger with Infusionz LLC (the “Infusionz Agreement”) with the members of Infusionz LLC (the “Sellers”). Pursuant to the terms of the Infusionz Agreement, on July 1, 2020, the Company acquired 100% of the outstanding membership interests of Infusionz LLC, a Colorado limited liability company (“Infusionz”).
On August 1, 2021, the Company completed an asset purchase agreement with Grove Acquisition Subsidiary, Inc., a Nevada corporation and wholly owned subsidiary of the Company and the members of VitaMedica Corporation, a California corporation to purchase all the assets and assume certain liabilities of VitaMedica. VitaMedica is a leading online seller of supplements for surgery, recovery, skin, beauty, health, and wellness.
| 4 |
| Table of Contents |
Emerging Growth Company Status
We are an emerging growth company under the JOBS Act. We shall continue to be deemed an emerging growth company until the earliest of:
|
| 1. | The last day of the fiscal year of the issuer during which it had total annual gross revenues of $1,007,000,000 (as such amount is indexed for inflation every 5 years by the Commission to reflect the change in the Consumer Price Index for All Urban Consumers published by the Bureau of Labor Statistics, setting the threshold to the nearest 1,007,000) or more; |
|
|
|
|
|
| 2. | The last day of the fiscal year of the issuer following the fifth anniversary of the date of the first sale of common equity securities of the issuer pursuant to an effective IPO registration statement; |
|
|
|
|
|
| 3. | The date on which such issuer has, during the previous 3-year period, issued more than $1,007,000,000 in non- convertible debt; or |
|
|
|
|
|
| 4. | The date on which such issuer is deemed to be a ‘large accelerated filer’, as defined in section 240.12b-2 of title 46, Code of Federal Regulations, or any successor thereto. |
As an emerging growth company, we are exempt from Section 404(b) of Sarbanes Oxley. Section 404(a) requires issuers to publish information in their annual reports concerning the scope and adequacy of the internal control structure and procedures for financial reporting. This statement shall also assess the effectiveness of such internal controls and procedures. Section 404(b) requires that the registered accounting firm shall, in the same report, attest to and report on the assessment and the effectiveness of the internal control structure and procedures for financial reporting.
As an emerging growth company, we are also exempt from Section 14A (a) and (b) of the Securities Exchange Act of 1934 which require the shareholder approval of executive compensation and golden parachutes. These exemptions are also available to us as a Smaller Reporting Company.
DESCRIPTION OF BUSINESS
Our Company
We are in the business of developing, producing, marketing and selling raw materials, white label products and end consumer products containing the industrial hemp plant extract, Cannabidiol (“CBD”). We sell to numerous consumer markets including the botanical, beauty care, pet care and functional food sectors. We seek to take advantage of an emerging worldwide trend to re-energize the production of industrial hemp and to foster its many uses for consumers. The development of products in this highly regulated industry carries significant risks and uncertainties that are beyond our control. As a result, we cannot assure that we will successfully market and sell our products or, if we are able to do so, that we can achieve sales volume levels that will allow us to cover our fixed costs.
The Company primarily conducts its business operations through its wholly-owned subsidiaries: Steam Distribution, LLC, a California limited liability company (“Steam Distribution”), One Hit Wonder, Inc., a California corporation (“One Hit Wonder”), Havz, LLC, d/b/a Steam Wholesale, a California limited liability company (“Steam Wholesale”), and One Hit Wonder Holdings, LLC, a California limited liability company (“OHWH”, and collectively known with Steam Distribution, One Hit Wonder, and Steam Wholesale as “HAVZ Consolidated”); SWCH LLC, a Delaware limited liability company (“SWCH”); Trunano Labs, Inc., a Nevada corporation (“Trunano”); Infusionz LLC, a Colorado limited liability company (“Infusionz”); and Cresco Management, LLC, a California limited liability company (“Cresco”).
| 5 |
| Table of Contents |
Historically cultivated for industrial and practical purposes, hemp is used today for textiles, paper, auto parts, biofuel, cosmetics, animal feed, supplements and much more - an impressive scope for such a historically misunderstood and restricted commodity. The market for hemp-derived products is expected to increase exponentially over the next five years2, and we believe Grove is well positioned to take advantage of this growth in the hemp industry.
In the U.S., hemp products that are manufactured by Grove are regulated by the Federal Food and Drug Administration, the Federal Trade Commission, the United States Department of Agriculture and various agencies within the individual States. As an initial matter, the hemp products manufactured and distributed by Grove must meet the requirements of the Agricultural Improvement Act of 2018 (the “Farm Bill”). Under the Farm Bill, all hemp products must contain no more than 0.3% of 9-delta-tetraydrocannabidiols (“9-delta”) on a dry weight basis. To ensure compliance with this section, Grove requires that all hemp products it manufactures and distributes to contain no more than 0.3% of all tetraydrocannabidiols not simply 9-delta. The Farm Bill also requires that Grove only use hemp that are duly licensed under state law or pursuant to the regulations issued by the USDA. Consequently, the Company processes, develops, manufactures, and sells its products pursuant to the Farm Bill. CBD products manufactured and distributed by Grove Inc. must also meet the requirements of the Federal Food, Drug, and Cosmetic Act (“FDCA”) and the Federal Food and Drug Administration’s (the “FDA”) regulations implementing the FDCA. While neither the FDCA nor FDA has specific provisions that related to the marketing of hemp products, the products are subject to the general adulteration and labeling provisions of the FDCA and FDA’s regulations depending on whether the product is marketed as a cosmetic, dietary supplement of food. The permissibility of hemp products containing cannabinoids remains in a state of flux. The FDA has issued guidance titled “FDA Regulation of Cannabis and Cannabis-Derived Products, Including Cannabidiol (CBD)” pursuant to which the FDA has taken the position that cannabidiol (“CBD”) is prohibited from use as an ingredient in a food or beverage or as a dietary ingredient in or as a dietary supplement based on several provisions of the FDCA. In the definition of “dietary supplement” found in the FDCA at 201 201(ff), an article authorized for investigation as a new drug, antibiotic, or biological for which substantial clinical investigations have been instituted and for which the existence of such investigations has been made public, is excluded from the definition of dietary supplement. A similar provision in the FDCA at 301(ll) makes it a prohibited act to introduce or deliver into commerce any food with a substance that was investigated as a new drug prior to being included in a food. There are no similar exclusions for the use of CBD in non-drug topical products, as long as such products otherwise comply with applicable laws. The FDA created a task force to address the further regulation of CBD and other cannabis-derived products and is currently evaluating the applicable science and pathways for regulating CBD and other cannabis-derived ingredients. Additionally, various states have enacted state-specific laws pertaining to the handling, manufacturing, labeling, and sale of CBD and other hemp products. Compliance with state-specific laws and regulations could impact our operations in those specific states. It is important to note that FDA has not taken any specific positions regarding the regulatory status of other cannabinoids, for example CBDA, CBDG, and CBDN. Finally, the Federal Trade Commission is the agency that is vested with ensuring that all marketing claims for hemp products are truthful and non-misleading.
In addition, through one of our wholly owned subsidiaries, we produce primarily business-to-business CBD related trade shows in the United States and were looking to expand prior to the COVID-19 pandemic. The trade shows have been profitable and allow Grove to market its own CBD products while also increasing the awareness of the expanding CBD market to the public.
The following is the ownership structure chart of the Company and its wholly owned subsidiaries as of June 30, 2021:
Grove is committed to providing high quality hemp products at competitive prices in retail, white label, private label and custom formulation programs. Our white label manufacturing is the partner of choice for many of the industries brands and the list of brands and products we service continues to expand. We have also set out to develop a world-class portfolio of our own proprietary brands that we believe will, over time, deliver higher margins and create long-term value.
| 6 |
| Table of Contents |
We operate manufacturing and distribution centers in Las Vegas, Nevada and Denver, Colorado and expect to expand into the eastern US with a new sale and distribution center in Florida scheduled to be opened in late 2021. While we currently do not export our products directly to Europe, in the prior 12 months, we sold flavoring products (which do not include hemp or CBD) to one end user customer that in turn distributed such product to several European countries in which it operates. We have no immediate plans to export or distribute any products to Europe.
Our Products
Grove, Inc. is focused on the manufacturing of CBD products through custom manufacturing, wholesale distribution and retail sales. Our primary products are Gummies, Tinctures, Topical Cosmetics and Flower, with a variety of formulas of cannabinoids and other additives. Our products use Full-spectrum CBD, Broad-spectrum and CBD isolate.
The industrial hemp market is projected to grow at a Compound Annual Growth Rate (“CAGR”) of 34% from USD 4.6 billion in 2019 to USD 26.6 billion by 2025. The growth of this market is attributed to the increased consumption of hemp-based products. However, the complex regulatory structure for the usage of industrial hemp in different countries is expected to hinder the market growth of industrial hemp.
The market, customers and distribution methods for hemp-based products are large and diverse. These markets range from hemp-based consumables, cosmetics, bio plastics and textiles, to list a few. This is an ever-evolving distribution system that today includes early adopter retailers and ecommerce entities, and product development companies that use our manufacturing capabilities to produce their internally developed consumer products for distribution. In addition, many of our customers use our propriety products and sell them under their own labels.
There are approximately 60 outlets in mainstream commercial and retail stores that currently stock and sell our products, with the most significant concentration in Arkansas, Tennessee and Texas. However, we believe that as awareness continues to grow for hemp-based products, such as CBD and other products derived from hemp, the market has and will continue to grow over the next several years.
Our target customers are first and foremost end consumers via internet sales, direct-to-consumer retail stores, cooperatives, affiliate sales and master distributors. Secondarily, we are targeting developers of products that we can easily produce with our manufacturing capabilities, national and regional broker networks and major distribution companies who have preexisting relationships with major retail chain stores. As we continue to develop our business, these markets may change, be re-prioritized or eliminated as management responds to consumer and regulatory developments.
| 7 |
| Table of Contents |
Our Competitive Strengths
We attribute our success to the following Growth in CBD Manufacturing.
Growing Participant in CBD Product Manufacturing. We are a growing North American distributor and manufacturer of premium CBD products for many of the largest CBD distributors and brands. We manufacture most of our products in our Henderson Nevada leased facility. We believe that loyalty to our brands continues to strengthen as we continue to expand our capabilities and product offering to existing and new customers.
Market Knowledge and Understanding. Due to our experience and our research and development of quality CBD products as well as expansion into new and varied formulations and product categories, we believe our long-term industry relationships will continue to expand. We continue to have a keen understanding of customer needs and desires in both our B2B and B2C customer categories. Custom formulations and a continued commitment to new and improved products at the best possible price has created strong customer demand and a robust pipeline.
Comprehensive Product Offering. We believe we offer a comprehensive portfolio of CBD products and maintain over 1,000 SKUs (stock keeping units) for our customers to choose from. This broad product offering creates a “one-stop” shop for our customers and positively distinguishes us from our competitors. In addition, we are cultivating a portfolio of well-known brands and premium products.
Trade Show Market. Our market position in the CBD industry trade show continues to drive sales and market exposure. Although COVID-19 led to cancelation of our November 2020 show, we believe that the latest breakthroughs with the vaccine and additional precautionary measures will enable us to conduct our next show in the late 2021 expected to take pace in Las Vegas. The brand loyalty and the exposure our show customers receive with premium booth placements has driven a large demand and we anticipate continuing the growth of the tradeshow business in fiscal year 2022.
Professionalism and Entrepreneurial Culture. Our professionalism and entrepreneurial culture foster highly dedicated employees who provide our customers with unsurpassed customer service. We continue to invest in our talent by providing every sales representative with an extensive and ongoing education and have successfully developed programs that provide comprehensive product knowledge and the tools needed to have a unique understanding of our customers’ personalities and decision-making processes.
Relationships and Superior Service first. We aim to be the premier partner for our customers and suppliers.
|
| · | Customers. We strive to offer unsurpassed solutions to our customers and also provide comprehensive product offering, proprietary industry formulations and development. We deliver products to our customers in a precise, safe and timely manner with complementary support from our dedicated sales and service teams. |
|
|
|
|
|
|
· | Suppliers. Our industry knowledge, market reach and resources allow us to establish trusted professional relationships with many of our product suppliers. Our expanding product lines continue to drive demand for our raw materials, the continuing increases have allowed us to negotiate what we believe to be the best possible pricing for our customers, while maintaining a quality growing relationship with the suppliers. |
Experienced and Proven Management Team Driving Growth through Organic and Accretive Acquisition Opportunities. We believe our management team has extensive experience in the industry. Our senior management team brings experience in accounting, mergers and acquisitions, financial services, consumer packaged goods, retail operations and third-party logistics.
| 8 |
| Table of Contents |
Our Growth Strategy
Our growth will continue to be focused on the vertical integration and growth of all segments of the CBD space:
CBD Product Research and Development. Our team provides custom products and proprietary formulations for some of the most popular industry items. We also continue to expand product offerings with the development and launch of new items on a regular basis. Custom formulations for outside brands build long term commitments from our customers.
Direct-to-Consumer Expansion. Our direct-to-consumer business is expected to be our growth driver for the next several years. The lower cost of our in-house research, development and manufacturing give us a measurable cost and production advantage, which we believe to be the key to our future success, as margins in the industry compress and are expected to continue to compress over the next several years.
CBD.io Market Place and Trade Show. Our launch of the CBD.io market platform in 2021 is expected to be a driver for growth into 2022 and a driver of retention for the brands that manufacture for us and list acceptable products on the platform. This high margin business should be a driver for future growth in all segments of the business.
Dependable White/Private Label Manufacturing Service. Our experience and dedicated team continue to refine and expand our white label program and has become a manufacturer to many regional and nationwide brands. Our operations in this segment have doubled over 2020, which we attribute to our commitment to high quality and on time manufacturing.
Our market position in the CBD industry trade show continues to drive sales and market exposure. Although COVID-19 led to cancelation of our November 2020 show, we believe that the latest breakthroughs with the vaccine and additional safety measures will enable us to conduct our next show in late 2021 expected to take place in Las Vegas. The brand loyalty and the exposure our show customers receive with premium booth placements has driven a large demand and we anticipate expansion of shows and venues in fiscal year 2022.
Core Brand Distribution. The nationwide rollout of our in-house brands will be another substantial driver of growth for the foreseeable future, we began expansion of our sales and marketing teams into the beginning of 2021 and will look to add talented people in all areas of the business to push current and future growth opportunities.
Acquisition Strategy. We have completed two acquisitions through June 30, 2021 with the consolidation and synergies expected to be completed October 2021. In addition, we have acquired VitaMedica Corporation on August 1, 2021 and expect distribution and administrative functions to be completed prior to December 31, 2021. We will continue to search for target acquisitions that meet our acquisition criteria and are accretive to our business. Our platform was built from the ground up to promote acquisitions expansion as a driver of substantial growth as the industry matures and margins compress. Our relationships and partners in the trade show and manufacturing business will be a key source for possible candidates. Our criteria will be stringent, and we will look at any and all opportunities that allow us to use our low-cost manufacturing to drive higher margins in acquisition candidates. Small regional brands with distribution would benefit greatly in both low-cost manufacturing and quality research and development of new and current product offerings available from our inhouse brands and products. As margins compress in the industry, the low-cost manufacturing capabilities will be a key component to higher profits leading to consolidation which we intend to capitalize on in the coming years.
| 9 |
| Table of Contents |
Competition
There is vigorous competition within each market where our CBD products are sold. Brand recognition, quality, performance, availability, and price are some of the factors that impact consumers’ choices among competing products and brands. Advertising, promotion, merchandising and the pace and timing of new product introductions also have a significant impact on consumers’ buying decisions. We compete against several national and international companies, most of which have substantially greater resources than we do. Our principal competitors consist of large, well-known, multinational manufacturers and marketers of CBD products, most of which market and sell their products under multiple brand names. They include, among others, 3CHI, Spring Creek Labs, Kazmira LLC, Global Cannabinoids, Triangle Trading Company, Harbor City Hemp and many others. We also face competition from several independent brands, as well as some retailers that have developed their own CBD brands. Certain of our competitors also have ownership interests in retailers that are customers of ours. While we expect we will seek to address the aspirations of our customers at attainable price points which we believe may give us a competitive advantage, there are no assurances we will ever be able to effectively compete within this sector.
Government Regulation
We are subject to laws and regulations affecting our operations in a number of areas. These laws and regulations affect the Company’s activities in areas, including, but not limited to, the hemp business in the United States, the consumer products and nutritional supplement markets in the United States, consumer protection, labor, intellectual property ownership and infringement, import and export requirements, federal and state healthcare, environmental and safety. The successful execution of our business objectives will be contingent upon our compliance with all applicable laws and regulations and obtaining all necessary regulatory approvals, permits and registrations, which may be onerous and expensive. Any such costs, which may rise in the future as a result of changes in such applicable laws and regulations and the expansion of the Company’s business, could make our products less attractive to our customers, delay the introduction of new products, and require the Company to implement policies and procedures designed to ensure compliance with applicable laws and regulations.
We operate our business in markets that are both highly regulated and rapidly evolving. We are subject to numerous federal and state laws and regulations affecting the manufacturing, packaging, labeling and sale of food, beverages, dietary supplements, and personal care products/cosmetics, as well as the use of hemp and hemp-derived ingredients like CBD in such products. The FDA regulates hemp and hemp-derived ingredients in FDA-regulated products pursuant to the provisions of the FDCA and regulations promulgated pursuant to it, in particular those related to adulteration and labeling of cosmetic, food, and dietary supplements. The FDA has issued guidance on the subject and issued letters to companies regarding claims made for products and the use of such ingredients in various products. The FDA also initiated a task force to evaluate pathways for further regulation of hemp and hemp-derived ingredients. At various times, bills pertaining to the regulation of hemp and hemp-derived ingredients have been introduced in both the U.S. Senate and the U.S. House of Representatives, and additional proposed legislation is expected to be introduced in the future to clarify the regulatory status of cannabinoids from hemp generally and CBD generally. Future legislation approved by Congress and signed by the President, or rulemaking promulgated by the FDA, could either positively or adversely impact the future sale of products by the Company.
We are currently not subject to any foreign regulations as we do not currently distribute or export any products, including hemp or CBD related products outside the U.S. Additionally, we are not aware of any foreign regulations that we had to comply with in regard to the sale of our flavoring products to one end user customer in the U.S. who distributed such products to Europe where it had operations. The responsibility for compliance with any European regulations would be on such customer.
Additionally, numerous states have passed forms of hemp legislation governing the cultivation of hemp, as well as the further processing and sale of hemp and products with hemp or hemp-derived ingredients. Those states that have not yet enacted laws or issued regulations pertaining to hemp and hemp-derived ingredients may do so in the near future. Unless Congress specifically enacts laws preempting the state regulations of hemp products we will continue to be subject not only to federal law but various state laws. Presently, Grove and only distributes hemp-products in states that it is legal to do so. Changes in the state laws and regulations could again either positively or adversely affect our ability to sell products in those states.
Employees
The Company has 122 full-time employees working out of its headquarters in Henderson, Las Vegas, its Denver Colorado manufacturing facility, Los Angeles California or individuals’ home-based offices.
| 10 |
| Table of Contents |
WHERE YOU CAN FIND MORE INFORMATION
You are advised to read this Form 10-K in conjunction with other reports and documents that we file from time to time with the SEC. You may obtain copies of these reports directly from us or from the SEC at the SEC’s Public Reference Room at 100 F. Street, N.E. Washington, D.C. 20549, and you may obtain information about obtaining access to the Reference Room by calling the SEC at 1-800-SEC-0330. In addition, the SEC maintains information for electronic filers at its website http://www.sec.gov.
Investing in our common stock involves a high degree of risk. You should consider carefully the risks, uncertainties and other factors described below, in addition to the other information set forth in this Form 10-K, before making an investment decision. Any of these risks, uncertainties and other factors could materially and adversely affect our business, financial condition, results of operations, cash flows or prospects. In that case, the market price of our common stock could decline, and you may lose all or part of your investment in our common stock. See also “Cautionary Statement Regarding Forward-Looking Statements.”
Risks Relating to Our Company
Our limited operating history makes it difficult for potential investors to evaluate our business prospects and management.
The Company was incorporated on September 5, 2018 and only commenced operations thereafter. Accordingly, we have a limited operating history upon which to base an evaluation of our business and prospects. Operating results for future periods are subject to numerous uncertainties, and we cannot assure you that the Company will achieve or sustain profitability in the future.
The Company’s prospects must be considered in light of the risks encountered by companies in the early stage of development, particularly companies in new and rapidly evolving markets. Future operating results will depend upon many factors, including our success in attracting and retaining motivated and qualified personnel, our ability to establish short term credit lines or obtain financing from other sources, such as this Offering, our ability to develop and market new products, our ability to control costs, and general economic conditions. We cannot assure you that the Company will successfully address any of these risks. There can be no assurance that our efforts will be successful or that we will ultimately be able to attain profitability.
If we are unable to protect our intellectual property rights, our competitive position could be harmed.
Our commercial success will depend in part on our ability to obtain and maintain appropriate intellectual property protection in the United States and foreign countries with respect to our proprietary formulations and products. Our ability to successfully implement our business plan depends on our ability to build and maintain brand recognition using trademarks, service marks, trade dress and other intellectual property. We may rely on trade secret, trademark, patent and copyright laws, and confidentiality and other agreements with employees and third parties, all of which offer only limited protection. The steps we have taken and the steps we will take to protect our proprietary rights may not be adequate to preclude misappropriation of our proprietary information or infringement of our intellectual property rights. If our efforts to protect our intellectual property are unsuccessful or inadequate, or if any third party misappropriates or infringes on our intellectual property, the value of our brands may be harmed, which could have a material adverse effect on the Company’s business and prevent our brands from achieving or maintaining market acceptance. Protecting against unauthorized use of our trademarks and other intellectual property rights may be expensive, difficult and in some cases not possible. In some cases, it may be difficult or impossible to detect third-party infringement or misappropriation of our intellectual property rights and proving any such infringement may be even more difficult.
| 11 |
| Table of Contents |
We may not be able to effectively manage growth.
As we continue to grow our business and develop products, we expect to need additional research, development, managerial, operational, sales, marketing, financial, accounting, legal and other resources. The Company expects its growth to place a substantial strain on its managerial, operational and financial resources. The Company cannot assure that it will be able to effectively manage the expansion of its operations, or that its facilities, systems, procedures or controls will be adequate to support its operations. The Company’s inability to manage future growth effectively would have a material adverse effect on its business, financial condition and results of operations.
Our management may not be able to control costs in an effective or timely manner.
The Company’s management has used reasonable efforts to assess, predict and control costs and expenses. However, the Company only has a brief operating history upon which to base those efforts. Implementing our business plan may require more employees, capital equipment, supplies or other expenditure items than management has predicted. Likewise, the cost of compensating employees and consultants or other operating costs may be higher than management’s estimates, which could lead to sustained losses.
We expect our quarterly financial results to fluctuate.
We expect our net sales and operating results to vary significantly from quarter to quarter due to a number of factors, including changes in:
|
| · | Demand for our products; |
|
| · | Our ability to obtain and retain existing customers or encourage repeat purchases; |
|
| · | Our ability to manage our product inventory; |
|
| · | General economic conditions, both domestically and in foreign markets; |
|
| · | Advertising and other marketing costs; and |
|
| · | Costs of creating and expanding product lines. |
As a result of the variability of these and other factors, our operating results in future quarters may be below the expectations of our stockholders.
We are subject to the reporting requirements of U.S. federal securities laws, which can be expensive.
We will be subject to the information and reporting requirements of the Exchange Act and other federal securities laws, including compliance with the Sarbanes-Oxley Act. The costs of preparing and filing annual and quarterly reports, proxy statements and other information with the SEC and furnishing audited financial statements to stockholders will cause our expenses to be higher than they would be if we had remained privately held. In addition, it may be time consuming, difficult and costly for us to develop and implement the internal controls and reporting procedures required by the Sarbanes-Oxley Act. We may need to hire additional financial reporting, internal controls and other finance personnel in order to develop and implement appropriate internal controls and reporting procedures.
| 12 |
| Table of Contents |
Cybersecurity breaches of our IT systems could degrade our ability to conduct our business operations and deliver products and services to our customers, delay our ability to recognize revenue, compromise the integrity of our software products, result in significant data losses and the theft of our intellectual property, damage our reputation, expose us to liability to third parties and require us to incur significant additional costs to maintain the security of our networks and data.
We increasingly depend upon our IT systems to conduct virtually all of our business operations, ranging from our internal operations and product development activities to our marketing and sales efforts and communications with our customers and business partners. Computer programmers may attempt to penetrate our network security, or that of our website, and misappropriate our proprietary information or cause interruptions of our service. Because the techniques used by such computer programmers to access or sabotage networks change frequently and may not be recognized until launched against a target, we may be unable to anticipate these techniques. In addition, sophisticated hardware and operating system software and applications that we produce or procure from third parties may contain defects in design or manufacture, including “bugs” and other problems that could unexpectedly interfere with the operation of the system. We have also outsourced a number of our business functions to third-party contractors, including our manufacturers and logistics providers, and our business operations also depend, in part, on the success of our contractors’ own cybersecurity measures. Similarly, we rely upon distributors, resellers and system integrators to sell our products and our sales operations depend, in part, on the reliability of their cybersecurity measures. Additionally, we depend upon our employees to appropriately handle confidential data and deploy our IT resources in safe and secure fashion that does not expose our network systems to security breaches and the loss of data. Accordingly, if our cybersecurity systems and those of our contractors fail to protect against unauthorized access, sophisticated cyberattacks and the mishandling of data by our employees and contractors, our ability to conduct our business effectively could be damaged in a number of ways, including:
We may incur significant costs and require significant management resources to evaluate our internal control over financial reporting as required under Section 404 of the Sarbanes-Oxley Act, and any failure to comply or any adverse result from such evaluation may have an adverse effect on our stock price.
As a smaller reporting company, as defined in Rule 12b-2 under the Exchange Act, we will be required to evaluate our internal control over financial reporting under Section 404 of the Sarbanes-Oxley Act of 2002 (“Section 404”) and to include an internal control report beginning with the Annual Report on Form 10-K for the fiscal year ending June 30, 2022. This report must include management’s assessment of the effectiveness of our internal control over financial reporting as of the end of the fiscal year. This report must also include disclosure of any material weaknesses in internal control over financial reporting that we have identified. Failure to comply, or any adverse results from such evaluation could result in a loss of investor confidence in our financial reports and have an adverse effect on the trading price of our equity securities.
The COVID-19 pandemic and the efforts to mitigate its impact may have an adverse effect on our business, liquidity, results of operations, financial condition and price of our securities.
The pandemic involving the novel strain of coronavirus and related respiratory disease (which we refer to as COVID-19) and the measures taken to combat it, have had an adverse effect on our business. Public health authorities and governments at local, national and international levels have announced various measures to respond to this pandemic. Some measures that directly or indirectly impact our business include:
|
| · | voluntary or mandatory quarantines; |
|
| · | restrictions on travel; and |
|
| · | limiting gatherings of people in public places. |
We have undertaken measures in an effort to mitigate the spread of COVID-19 including limiting company travel and in-person meetings. We also have enacted our business continuity plans, including implementing procedures requiring employees working remotely where possible which may make maintaining our normal level of corporate operations, quality controls and internal controls difficult. Notwithstanding these efforts, our results of operations have been adversely impacted by COVID-19 and this may continue.
Moreover, the COVID-19 pandemic has previously caused some temporary delays in the delivery of our inventory, although recently we are no longer experiencing such delays. In addition, the travel restrictions imposed as a result of COVID-19 have impacted our ability to visit customer and potential customers for sales presentations, which have been substituted with on-line conference calls. Further, the COVID-19 pandemic and mitigation efforts have also adversely affected our customers’ financial condition, resulting in reduced spending for the products we sell.
| 13 |
| Table of Contents |
As events are rapidly changing, we do not know how long the COVID-19 pandemic, or localized outbreaks or recurrences of COVID-19, and the measures that have been introduced to respond to COVID-19 will disrupt our operations or the full extent of that disruption. Further, once we are able to restart normal operations doing so may take time and will involve costs and uncertainty. We also cannot predict how long the effects of COVID-19 and the efforts to contain it will continue to impact our business after the pandemic is under control. Governments could take additional restrictive measures to combat the pandemic that could further impact our business or the economy in the geographies in which we operate. It is also possible that the impact of the pandemic and response on our suppliers, customers and markets will persist for some time after governments ease their restrictions. These measures have negatively impacted, and may continue to impact, our business and financial condition as the responses to control COVID-19 continue.
A prolonged economic downturn, particularly in light of the COVID-19 pandemic, could adversely affect our business.
Uncertain global economic conditions, in particular in light of the COVID-19 pandemic, could adversely affect our business. Negative global and national economic trends, such as decreased consumer and business spending, high unemployment levels and declining consumer and business confidence, pose challenges to our business and could result in declining revenues, profitability and cash flow. Although we continue to devote significant resources to support our brands, unfavorable economic conditions may negatively affect demand for our products.
Increases in costs, disruption of supply or shortage of raw materials could harm our business.
We may experience increases in the cost or a sustained interruption in the supply or shortage of raw materials. Any such an increase or supply interruption could materially negatively impact our business, prospects, financial condition and operating results. We use various raw materials in our business including aluminum. The prices for these raw materials fluctuate depending on market conditions and global demand for these materials and could adversely affect our business and operating results. Substantial increases in the prices for our raw materials increase our operating costs and could reduce our margins if we cannot recoup the increased costs through increased prices for our products.
Our failure to meet the continuing listing requirements of the NASDAQ Capital Market could result in a de-listing of our securities.
If, after this offering, we fail to satisfy the continuing listing requirements of NASDAQ, such as the corporate governance, stockholders’ equity or minimum closing bid price requirements, NASDAQ may take steps to delist our Common Stock. Such a delisting would likely have a negative effect on the price of our Common Stock and would impair your ability to sell or purchase our Common Stock when you wish to do so. In the event of a delisting, we would likely take actions to restore our compliance with NASDAQ’s listing requirements, but we can provide no assurance that any such action taken by us would allow our Common Stock to become listed again, stabilize the market price or improve the liquidity of our securities, prevent our Common Stock from dropping below the NASDAQ minimum bid price requirement or prevent future non-compliance with NASDAQ’s listing requirements.
We will incur increased costs and demands upon management as a result of complying with the laws and regulations affecting public companies, which could adversely affect our operating results.
As a public company, we will incur significant legal, accounting and other expenses that we did not incur as a private company, including costs associated with public company reporting and corporate governance requirements. These requirements include compliance with Section 404 and other provisions of the Sarbanes-Oxley Act, as well as rules implemented by the Securities and Exchange Commission, or SEC, and the NASDAQ. In addition, our management team will also have to adapt to the requirements of being a public company. We expect complying with these rules and regulations will substantially increase our legal and financial compliance costs and to make some activities more time-consuming and costly.
| 14 |
| Table of Contents |
The increased costs associated with operating as a public company will decrease our net income or increase our net loss and may require us to reduce costs in other areas of our business or increase the prices of our products. Additionally, if these requirements divert our management’s attention from other business concerns, they could have a material adverse effect on our business, financial condition and operating results.
As a public company, we also expect that it may be more difficult and more expensive for us to obtain director and officer liability insurance, and we may be required to accept reduced policy limits and coverage or incur substantially higher costs to obtain the same or similar coverage. As a result, it may be more difficult for us to attract and retain qualified individuals to serve on our board of directors or as our executive officers.
We are eligible to be treated as an “emerging growth company,” as defined in the JOBS Act, and a “smaller reporting company” within the meaning of the Securities Act, and we cannot be certain if the reduced disclosure requirements applicable to emerging growth companies or smaller reporting companies will make our Common Stock less attractive to investors.
We are an “emerging growth company,” as defined in the JOBS Act. For as long as we continue to be an emerging growth company, we may take advantage of exemptions from various reporting requirements that are applicable to other public companies that are not emerging growth companies, including (1) not being required to comply with the auditor attestation requirements of Section 404 of the Sarbanes-Oxley Act, (2) reduced disclosure obligations regarding executive compensation in this annual report and our periodic reports and proxy statements and (3) exemptions from the requirements of holding a nonbinding advisory vote on executive compensation and stockholder approval of any golden parachute payments not previously approved. In addition, as an emerging growth company, we are only required to provide two years of audited financial statements and two years of selected financial data in this annual report. We could be an emerging growth company for up to five years, although circumstances could cause us to lose that status earlier, including if the market value of our Common Stock held by non-affiliates exceeds $700.0 million as of any December 31 before that time or if we have total annual gross revenue of $1.0 billion or more during any fiscal year before that time, after which, in each case, we would no longer be an emerging growth company as of the following December 31 or, if we issue more than $1.0 billion in non-convertible debt during any three-year period before that time, we would cease to be an emerging growth company immediately.
Additionally, we are a “smaller reporting company” as defined in Item 10(f)(1) of Regulation S-K. Smaller reporting companies may take advantage of certain reduced disclosure obligations, including, among other things, providing only two years of audited financial statements. We will remain a smaller reporting company until the last day of the fiscal year in which (1) the market value of our shares of Common Stock held by non-affiliates exceeds $250 million as of the prior the end of our second fiscal quarter ending December 31 of each year, or (2) our annual revenues exceeded $100 million during such completed fiscal year and the market value of our ordinary shares held by non-affiliates exceeds $700 million as of the prior to the end of our second fiscal quarter ending December 31 of each year. To the extent we take advantage of such reduced disclosure obligations, it may also make comparison of our financial statements with other public companies difficult or impossible.
After we are no longer an “emerging growth company,” we expect to incur additional management time and cost to comply with the more stringent reporting requirements applicable to companies that are deemed accelerated filers or large accelerated filers, including complying with the auditor attestation requirements of Section 404 of the Sarbanes-Oxley Act. We cannot predict or estimate the amount of additional costs we may incur or the timing of such costs.
Risks Relating to Our Business and Industry
We operate in a highly competitive environment, and if we are unable to compete with our competitors, our business, financial condition, results of operations, cash flows and prospects could be materially adversely affected.
We operate in a highly competitive environment. Our competition includes all other companies that are in the business of producing or distributing hemp-based products for personal use or consumption. Many of our competitors have greater resources that may enable them to compete more effectively than us in the CBD industry. Some of our competitors have a longer operating history and greater capital resources, facilities and product line diversity, which may enable them to compete more effectively in this market. Our competitors may devote their resources to developing and marketing products that will directly compete with our product lines. The Company expects to face additional competition from existing competitors and new market entrants. If a significant number of new entrants enters the market in the near term, the Company may experience increased competition for market share and may experience downward pricing pressure on the Company’s products as new entrants increase production. Such competition may cause us to encounter difficulties in generating revenues and market share, and in positioning our products in the market. If we are unable to successfully compete with existing companies and new entrants to the market, our lack of competitive advantage will have a negative impact on our business and financial condition.
| 15 |
| Table of Contents |
Unfavorable publicity or consumer perception of our products or similar products developed and distributed by other companies could have a material adverse effect on our reputation, which could result in decreased sales and fluctuations in our business, financial condition and results of operations.
We depend on consumer perception regarding the safety and quality of our products, as well as similar products marketed and distributed by other companies. Consumer perception of hemp-based products can be significantly influenced by adverse publicity in the form of published scientific research, national media attention or other publicity, which may associate consumption of our products or other similar products with adverse effects or question the benefits and/or effectiveness of our products or similar products. A new product may initially be received favorably, resulting in high sales of that product, but that level of sales may not be sustainable as consumer preferences change over time. Future scientific research or publicity could be unfavorable to our industry or any of our particular products and may not be consistent with earlier favorable research or publicity. Unfavorable research or publicity could have a material adverse effect on our ability to generate sales.
Our failure to appropriately and timely respond to changing consumer preferences and demand for new products could significantly harm our customer relationships and have a material adverse effect on our business, financial condition and results of operations.
Our business is subject to changing consumer trends and preferences. Our failure to accurately predict or react to these trends could negatively impact consumer opinion of us as a source for the latest products, which in turn could harm our customer relationships and cause us to lose market share. The success of our product offerings depends upon a number of factors, including our ability to:
|
| · | Anticipate customer needs; |
|
| · | Innovate and develop new products; |
|
| · | Successfully introduce new products in a timely manner; |
|
| · | Price our products competitively with retail and online competitors; |
|
| · | Deliver our products in sufficient volumes and in a timely manner; and |
|
| · | Differentiate our product offerings from those of our competitors. |
If we do not introduce new products or make enhancements to meet the changing needs of our customers in a timely manner, some of our products could be rendered obsolete, which could have a material adverse effect on our financial condition and results of operations.
Future acquisitions or strategic investments and partnerships could be difficult to identify and integrate with our business, disrupt our business, and adversely affect our financial condition and results of operations.
We may seek to acquire or invest in businesses and product lines that we believe could complement or expand our product offerings, or otherwise offer growth opportunities. The pursuit of potential acquisitions may divert the attention of management and cause us to incur various expenses in identifying, investigating, and pursuing suitable acquisitions, whether or not the acquisitions are completed. Future acquisitions could also result in dilutive issuances of equity securities or the incurrence of debt, which could adversely affect our financial position and results of operations. In addition, if an acquired business or product line fails to meet our expectations, our business, financial condition, and results of operations may be adversely affected.
| 16 |
| Table of Contents |
Failure to successfully integrate acquired businesses and their products and other assets into our Company, or if integrated, failure to further our business strategy, may result in our inability to realize any benefit from such acquisition.
We expect to grow by acquiring relevant businesses, including other cannabis-related businesses. The consummation and integration of any acquired business, product or other assets into our Company may be complex and time consuming and, if such businesses and assets are not successfully integrated, we may not achieve the anticipated benefits, cost-savings or growth opportunities. Furthermore, these acquisitions and other arrangements, even if successfully integrated, may fail to further our business strategy as anticipated, expose our Company to increased competition or other challenges with respect to our products or geographic markets, and expose us to additional liabilities associated with an acquired business, technology or other asset or arrangement.
The failure to attract and retain key employees could hurt our business.
Our success also depends upon our ability to attract and retain numerous highly qualified employees. The loss of one or more members of our management team or other key employees or consultants could materially harm our business, financial condition, results of operations and prospects. Although the Company’s current management team has extensive business background, their experience is in industries unrelated to our business. Management relies heavily on the experience of its employees, most notably its President who has extensive experience in CBD products. We face competition for personnel and consultants from other companies, universities, public and private research institutions, government entities and other organizations. Our failure to attract and retain skilled management and employees may prevent or delay us from pursuing certain opportunities. If we fail to successfully fill many management roles, fail to fully integrate new members of our management team, lose the services of key personnel, or fail to attract additional qualified personnel, it will be significantly more difficult for us to achieve our growth strategies and success.
We have limited supply sources, and price increases or supply shortages of key raw materials could materially and adversely affect our business, financial condition and results of operations.
Our products are composed of certain key raw materials. If the prices of such raw materials increase significantly, it could result in a significant increase in our product development costs. If raw material prices increase in the future, we may not be able to pass on such price increases to our customers. A significant increase in the price of raw materials that cannot be passed on to customers could have a material adverse effect on our business, financial condition and results of operations.
The Company believes that its continued success will depend upon the availability of raw materials that permit the Company to meet its labeling claims and quality control standards. The supply of our industrial hemp is subject to the same risks normally associated with agricultural production, such as climactic conditions, insect infestations and availability of manual labor or equipment for harvesting. Any significant delay in or disruption of the supply of raw materials could substantially increase the cost of such materials, could require product reformulations, the qualification of new suppliers and repackaging and could result in a substantial reduction or termination by the Company of its sales of certain products, any of which could have a material adverse effect upon the Company. Accordingly, there can be no assurance that the disruption of the Company’s supply sources will not have a material adverse effect on the Company.
Loss of key contracts with our suppliers, renegotiation of such agreements on less favorable terms or other actions these third parties may take could harm our business.
Most of our agreements with suppliers of our industrial hemp, including our key supplier contract, are short term. The loss of these agreements, or the renegotiation of these agreements on less favorable economic or other terms, could limit our ability to procure raw material to manufacture our products. This could negatively affect our ability to meet consumer demand for our products. Upon expiration or termination of these agreements, our competitors may be able to secure industrial hemp from our existing suppliers which will put the company at a competitive disadvantage in the market.
| 17 |
| Table of Contents |
Loss of key customers could harm our business.
For the year ended June 30, 2021, a significant portion of our sales were to two large customers, but we do not have contracts for future purchases in place with either of these customers. As such, we do not have any purchase commitments from these customers, and there can be no assurance that they will continue to purchase our products. If these customers do not purchase our products in the future, and we are not able to generate a similar volume of sales from other customers, it could have a material effect on our total sales and result in a material adverse effect on our financial condition and business.
There is limited availability of clinical studies.
Although hemp plants have a long history of human consumption, there is little long-term experience with human consumption of certain of these innovative product ingredients or combinations thereof in concentrated form. Although the Company performs research and/or tests the formulation and production of its products, there is limited clinical data regarding the safety and benefits of ingesting industrial hemp-based products. Any instance of illness or negative side effects of ingesting industrial hemp-based products would have a material adverse effect on our business and operations.
We face substantial risk of product liability claims and potential adverse product publicity.
Like any other retailer, distributor or manufacturer of products that are designed to be ingested, we face an inherent risk of exposure to product liability claims, regulatory action and litigation if our products are alleged to have caused loss or injury. In the event we do not have adequate insurance or contractual indemnification, product liability claims could have a material adverse effect on the Company. The Company is not currently a named defendant in any product liability lawsuit; however, other manufacturers and distributors of hemp-based products currently are or have been named as defendants in such lawsuits. The successful assertion or settlement of any uninsured claim, a significant number of insured claims, or a claim exceeding the Company’s insurance coverage could have a material adverse effect on the Company.
We may be unable to attract and retain independent distributors for our products.
As a direct selling company, our revenue depends in part upon the number and productivity of our independent distributors. Like most direct selling companies, we experience high levels of turnover among our independent distributors from year to year, who may terminate their service at any time. Generally, we need to increase the productivity of our independent distributors and/or retain existing independent distributors and attract additional independent distributors to maintain and/or increase product sales. Many factors affect our ability to attract and retain independent distributors, including the following:
|
| · | publicity regarding our Company, our products, our distribution channels and our competitors; |
|
| · | public perceptions regarding the value and efficacy of our products; |
|
| · | ongoing motivation of our independent distributors; |
|
| · | government regulations; |
|
| · | general economic conditions; |
|
| · | our compensation arrangements, training and support for our independent distributors; and |
|
| · | competition in the market. |
Our results of operations and financial condition could be materially and adversely affected if our independent distributors are unable to maintain their current levels of productivity, or if we are unable to retain existing distributors and attract new distributors in sufficient numbers to maintain present sales levels and sustain future growth.
| 18 |
| Table of Contents |
We could incur obligations resulting from the activities of our independent distributors.
We sell our products through a network of independent distributors. Independent distributors are independent contractors who operate their own business separate and apart from the Company. We may not be able to control certain aspects of our distributors’ activities that may impact our business. If local laws and regulations, or the interpretation thereof, change and require us to treat our independent distributors as employees, or if our independent distributors are deemed by local regulatory authorities in one or more of the jurisdictions in which we operate to be our employees rather than independent contractors under existing laws and interpretations, we may be held responsible for a variety of obligations that are imposed upon employers relating to their employees, including employment-related taxes and penalties, which could have a material adverse effect on our financial condition and results of operations. In addition, there is the possibility that some jurisdictions may seek to hold us responsible for false product or earnings-related claims due to the actions of our independent distributors. Liability for any of these issues could have a material adverse effect on our business, financial condition and results of operations.
If our independent distributors’ failure to comply with applicable advertising laws and regulations could adversely affect our financial conditions and results of operations.
The advertisement of our products is subject to extensive regulations in the markets in which we do business. Our independent distributors may fail to comply with such regulations governing the advertising of our products. We cannot ensure that all marketing materials used by our independent distributors comply with applicable regulations, including bans on false or misleading product and earnings-related claims. If our independent distributors fail to comply with applicable regulations, we could be subjected to claims of false advertising, misrepresentation, significant financial penalties, and/or costly mandatory product recalls and relabeling requirements with respect to our products, any of which could have a material adverse effect on our business, reputation, financial condition and results of operations.
We are subject to risks arising from the recent global outbreak of the COVID-19 coronavirus.
The recent outbreak of the COVID-19 coronavirus has spread across the globe and is impacting worldwide economic activity. A pandemic, including COVID-19 or other public health epidemic, poses the risk that we or our employees, suppliers, manufacturers and other partners may be prevented from conducting business activities for an indefinite period of time, including due to the spread of the disease or shutdowns that may be requested or mandated by governmental authorities. While it is not possible at this time to estimate the full impact that COVID-19 could have on our business, the continued spread of COVID-19 could disrupt our clinical trials, supply chain and the manufacture or shipment of our cyclodextrin products, and other related activities, which could have a material adverse effect on our business, financial condition and results of operations. COVID-19 has also had an adverse impact on global economic conditions which could impair our ability to raise capital when needed. While we have not yet experienced any disruptions in our business or other negative consequences relating to COVID-19, the extent to which the COVID-19 pandemic impacts our results will depend on future developments that are highly uncertain and cannot be predicted.
Risks Related to the CBD Industry
Laws and regulations affecting the CBD industry are evolving under the Farm Bill, and changes to applicable regulations may materially affect our future operations in the CBD market.
The CBD used by the Company is derived from hemp as defined in the Agriculture Improvement Act of 2018 (United States) (the “Farm Bill “) and codified at 7 USC 1639o means “the plant Cannabis sativa L. and any part of that plant, including the seeds thereof and all derivatives, extracts, cannabinoids, isomers, acids, salts, and salts of isomers, whether growing or not, with a delta-9 tetrahydrocannabinol concentration of not more than 0.3 percent on a dry weight basis.” The Cannabis sativa plant and its derivatives may also be deemed marijuana, depending on certain factors. “Marijuana” is a Schedule I controlled substance and is defined in the Federal Controlled Substances Act at 21 USC Section 802(16) as “all parts of the plant Cannabis sativa L., whether growing or not; the seeds thereof; the resin extracted from any part of such plant; and every compound, manufacture, salt, derivative, mixture, or preparation of such plant, its seeds or resin.” Exemptions to that definition provided in 21 USC Section 802(16) include “the mature stalks of such plant, fiber produced from such stalks, oil or cake made from the seeds of such plant, any other compound, manufacture, salt, derivative, mixture, or preparation of such mature stalks (except the resin extracted therefrom), fiber, oil, or cake, or the sterilized seed of such plant which is incapable of germination” or hemp as defined in 7 USC 1639o.
| 19 |
| Table of Contents |
Substances meeting the definition of “hemp” in the Farm Bill and 7 USC 1639o may be used in clinical studies and research through an Investigational New Drug (“IND”) application with the Food and Drug Administration (the “FDA”). Substances scheduled as controlled substances, like marijuana, require more rigorous regulation, including interaction with several agencies including the FDA, the DEA, and the NIDA within the National Institutes of Health (“NIH”).
Accordingly, if the CBD used by the Company is deemed marijuana and, therefore, a Schedule I controlled substance, the Company could be subject to significant additional regulation, as well as enforcement actions and penalties pertaining to the Federal Controlled Substances Act, and any resulting liability could require the Company to modify or cease its operations.
Furthermore, in conjunction with the Farm Bill, the FDA released a statement about the status of CBD use in food and dietary supplements, noting that the Farm Bill explicitly preserved the FDA’s authority to regulate products containing cannabis or cannabis-derived compounds under the Federal Food, Drug, and Cosmetic Act (the “FDCA”) and Section 351 of the Public Health Service Act. Any difficulties we experience in complying with existing and/or new government regulation could increase our operating costs and adversely impact our results of operations in future periods. The FDA has issued guidance titled “FDA Regulation of Cannabis and Cannabis-Derived Products, Including Cannabidiol (CBD)” pursuant to which the FDA has taken the position that CBD is prohibited from use as an ingredient in a food or beverage or as a dietary ingredient in or as a dietary supplement based on several provisions of the FDCA. In the definition of “dietary supplement” found in the FDCA at 201(ff), an article authorized for investigation as a new drug, antibiotic, or biological for which substantial clinical investigations have been instituted and for which the existence of such investigations has been made public, is excluded from the definition of dietary supplement. A similar provision in the FDCA 301(ll) makes it a prohibited act to introduce or deliver into commerce any food with a substance that was investigated as a new drug prior to being included in a food. There are no similar exclusions for the use of CBD in non-drug topical products, as long as such products otherwise comply with applicable laws. The FDA created a task force to address the further regulation of CBD and other cannabis-derived products and is currently evaluating the applicable science and pathways for regulating CBD and other cannabis-derived ingredients.
As a result of the Farm Bill’s recent passage, we expect that there will be a constant evolution of laws and regulations affecting the CBD industry which could affect the Company’s plan of operations. Local, state and federal hemp laws and regulations may be broad in scope and subject to changing interpretations. These changes may require us to incur substantial costs associated with legal compliance and may ultimately require us to alter our business plan. Furthermore, violations of these laws, or alleged violations, could disrupt our business and result in a material adverse effect on our operations. We cannot predict the nature of any future laws, regulations, interpretations or applications, and it is possible that regulations may be enacted in the future that will be directly applicable to our business.
Changes to state laws pertaining to industrial hemp could slow the use of industrial hemp, which could impact our revenues in future periods. Approximately 40 states have authorized industrial hemp programs pursuant to the Farm Bill. Additionally, various states have enacted state-specific laws pertaining to the handling, manufacturing, labeling, and sale of CBD and other hemp products. Compliance with state-specific laws and regulations could impact our operations in those specific states. Continued development of the industrial hemp industry will be dependent upon new legislative authorization of industrial hemp at the state level, and further amendment or supplementation of legislation at the federal level. Any number of events or occurrences could slow or halt progress all together in this space. While progress within the industrial hemp industry is currently encouraging, growth is not assured, and while there appears to be ample public support for favorable legislative action, numerous factors may impact or negatively affect the legislative process(es) within the various states where we have business interests.
| 20 |
| Table of Contents |
Unfavorable interpretations of laws governing hemp processing activities could subject us to enforcement or other legal proceedings and limit our business and prospects.
There are no express protections in the United States under applicable federal or state law for possessing or processing hemp biomass derived from lawful hemp not exceeding 0.3% THC on a dry weight basis and intended for use in finished product, but that may temporarily exceed 0.3% THC during the interim processing stages. While it is a common occurrence for hemp biomass to have variance in THC content during interim processing stages after cultivation but prior to use in finished products, there is risk that state or federal regulators or law enforcement could take the position that such hemp biomass is a Schedule I controlled substance in violation of the CSA and similar state laws. In the event that the Company’s operations are deemed to violate any laws, the Company could be subject to enforcement actions and penalties, and any resulting liability could cause the Company to modify or cease its operations.
Costs associated with compliance with various laws and regulations could negatively impact our financial results.
The manufacture, labeling and distribution of CBD products is regulated by various federal, state and local agencies. These governmental authorities may commence regulatory or legal proceedings, which could restrict our ability to market CBD-based products in the future. The FDA regulates our products to ensure that the products are not adulterated or misbranded. We may also be subject to regulation by other federal, state and local agencies with respect to our CBD-based products. Our advertising activities are subject to regulation by the FTC under the Federal Trade Commission Act. In recent years, the FTC and state attorneys general have initiated numerous investigations of dietary and nutritional supplement companies and products. Any actions or investigations initiated against the Company by governmental authorities or private litigants could have a material adverse effect on our business, financial condition and results of operations. Any actions or investigations initiated against the Company by governmental authorities or private litigants could have a material adverse effect on our business, financial condition and results of operations.
The shifting regulatory environment necessitates building and maintaining of robust systems to achieve and maintain compliance in multiple jurisdictions and increases the possibility that we may violate one or more of the legal requirements applicable to our business and products. If our operations are found to be in violation of any applicable laws or regulations, we may be subject to penalties, including, without limitation, civil and criminal penalties, damages, fines, the curtailment or restructuring of our operations, injunctions, or product withdrawals, recalls or seizures, any of which could adversely affect our ability to operate our business, our financial condition and results of operations.
Uncertainty caused by potential changes to legal regulations could impact the use and acceptance of CBD products.
There is substantial uncertainty and differing interpretations and opinions among federal, state and local regulatory agencies, legislators, academics and businesses as to the scope of operation of Farm Bill-compliant hemp programs relative to the emerging regulation of cannabinoids and the Controlled Substances Act. These different opinions include, but are not limited to, the regulation of cannabinoids by the DEA and/or the FDA, and the extent to which manufacturers of products containing Farm Bill-compliant cultivators and processors may engage in interstate commerce. The existing uncertainties in the CBD regulatory landscape in the United States cannot be resolved without further federal, and perhaps state-level, legislation and regulation or a definitive judicial interpretation of existing laws and regulations. If these uncertainties are not resolved in the near future or are resolved in the manner inconsistent with our business plan, such uncertainties may have an adverse effect upon our plan of operations and the introduction of our CBD-based products in different markets.
If we fail to obtain necessary permits, licenses and approvals under applicable laws and regulations, our business and plan of operations may be adversely impacted.
We may be required to obtain and maintain certain permits, licenses and regulatory approvals in the jurisdictions where we sell or plan to sell our products. There can be no assurance that we will be able to obtain or maintain any necessary licenses, permits or approvals. Any material delay in obtaining, or inability to obtain, such licenses, permits and approvals is likely to delay and/or inhibit our ability to carry out our plan of operations, and could have a material adverse effect on our business, financial condition and results of operations.
| 21 |
| Table of Contents |
Potential future international expansion of our business could expose us to additional regulatory risks and compliance costs.
Although we have no plans to expand internationally for at least two or more years, if the Company intends to expand internationally or engage in the international sale of its products, it will become subject to the laws and regulations of the foreign jurisdictions in which it operates, or in which it imports or exports products or materials, including, but not limited to, customs regulations in the importing and exporting countries. The varying laws and rapidly changing regulations may impact the Company’s operations and ability to ensure compliance. In addition, the Company may avail itself of proposed legislative changes in certain jurisdictions to expand its product portfolio, which expansion may include unknown business and regulatory compliance risks. Failure by the Company to comply with the evolving regulatory framework in any jurisdiction could have a material adverse effect on the Company’s business, financial condition and results of operations.
The market for CBD products is highly competitive. If we are unable to compete effectively in the market, our business and operating results could be materially and adversely affected.
The market for CBD products is a competitive and rapidly evolving market. There are numerous competitors in the industry, some of whom are more well-established with longer operating histories and greater financial resources than the Company. We expect competition in the CBD industry to continue to intensify following the recent passage of the Farm Bill. We believe the Company will be able to compete effectively because of the quality of our products and customer service. However, there can be no assurance that the Company will effectively compete with existing or future competitors. Increased competition may also drive the prices of our products down, which may have a material adverse effect on our results of operations in future periods.
Given the rapid changes affecting the global, national and regional economies generally, and the CBD industry specifically, the Company may experience difficulties in establishing and maintaining a competitive advantage in the marketplace. The Company’s success will depend on our ability to keep pace with any changes in such markets, especially legal and regulatory changes. Our success will depend on our ability to respond to, among other things, changes in the economy, market conditions and competitive pressures. Any failure to anticipate or respond adequately to such changes could have a material adverse effect on the Company’s business, financial condition and results of operations.
The Company may experience difficulty opening or maintaining bank accounts.
It is possible that financial institutions may refuse to open bank accounts for the deposit of funds from our business, as some of our products are involved with the hemp industry. The inability to open bank accounts with certain institutions could materially and adversely affect our business.
Item 1B. Unresolved Staff Comments
None.
Our executive office and main manufacturing warehouse are located at 1710 Whitney Mesa Drive, Henderson, NV 89014 under a one-year lease. The Company has a second manufacturing facility at 4986 Morrison Rd Denver, CO 80219 under a one-year lease. We have recently signed a three-year lease for a facility located at 15000 S. Avalon Blvd., Gardena, CA 90248.
From time to time, the Company may become involved in litigation relating to claims arising out of its operations in the normal course of business. The Company is not involved in any pending legal proceeding or litigation and, to the best of its knowledge, no governmental authority is contemplating any proceeding to which we are a party or to which any of its properties is subject, which would reasonably be likely to have a material adverse effect on the Company.
| 22 |
| Table of Contents |
Item 4. Mine Safety Disclosures
Not applicable.
Market Information
The Company’s common stock is listed on the NASDAQ and is traded under the symbol “GRVI.” The following table sets forth the quarterly high and low sales prices per share of the Company’s common stock on the consolidated market for each quarter within the last two fiscal years. The Company started trading on June 24, 2021.
|
|
| Fourth Quarter |
|
| Third Quarter |
|
| Second Quarter |
|
| First Quarter |
| ||||
| Fiscal 2021: |
|
|
|
|
|
|
|
|
|
|
|
| ||||
| High |
| $ | 7.79 |
|
| $ | - |
|
| $ | - |
|
| $ | - |
|
| Low |
|
| 2.81 |
|
|
| - |
|
|
| - |
|
|
| - |
|
Holders of Record
There were approximately 2,400 holders of record of the Company’s common stock on June 30, 2021.
Dividend Policy
We currently intend to retain our future earnings, if any, to finance the development and expansion of our businesses and, therefore, do not intend to pay cash dividends on our Common Stock for the foreseeable future. Any future determination to pay dividends will be at the discretion of our board of directors and will depend on our financial condition, results of operations, capital requirements, restrictions contained in any financing instruments, and such other factors as our board of directors deems relevant in its sole discretion. Accordingly, you may need to sell your shares of our Common Stock to realize a return on your investment, and you may not be able to sell your shares at or above the price you paid for them.
Securities Authorized for Issuance under Equity Compensation Plans
The Company has established a Company an incentive plan, 2019 Equity Incentive Plan (the “2019 Plan”). The plan grants incentives to select persons who can make, are making and continue to make substantial contributions to the growth and success of the Company, to attract and retain the employment and services of such persons and to encourage and reward such contributions by providing these individuals with an opportunity to acquire or increase stock ownership in the Company through either the grant of options or restructured stock. The 2019 Plan is administered by the Compensation Committee or such other committee as is appointed by the Board of Directors pursuant to the 2019 Plan (the “Committee”). The Committee has full authority to administer and interpret the provisions of the 2019 Plan including, but not limited to, the authority to make all determinations with regard to the terms and conditions of an award made under the 2019 Plan. On February 8, 2021, the Shareholders consented, and the Board of Directors approved the amendment of the Stock Option Plan to increase the maximum number of Shares that may be issued thereunder by 2,777,778 Shares to 5,555,555 Shares.
The Board of Directors of the Company may from time to time, in its discretion grant to directors, officers, consultants and employees of the Company, non-transferable options to purchase common shares. The options are exercisable for a period of up to 10 years from the date of the grant.
| 23 |
| Table of Contents |
| Plan category |
| Number of securities to be issued upon exercise of outstanding options, warrants and rights |
|
| Weighted-average exercise price of outstanding options, warrants and rights |
|
| Number of securities remaining available for future issuance under equity compensation plans (excluding securities reflected in first column) |
| |||
|
|
|
|
|
|
|
|
|
|
| |||
| Equity compensation plans approved by security holders |
|
| 2,088,333 |
|
| $ | 1.55 |
|
|
| 3,467,222 |
|
|
|
|
|
|
|
|
|
|
|
|
|
|
|
| Total |
|
| 2,088,333 |
|
| $ | 1.55 |
|
|
| 3,467,222 |
|
Recent Sales of Unregistered Securities; Use of Proceeds from Registered Securities
In October 2019, Allan Marshall exercised an option to purchase 277,778 shares of Common Stock at a $1.53 per common share. The Company received $400,000 of cash and relieved $25,000 in payables to Allan Marshall for the shares of common stock.
On June 24, 2021, the Company issued 274,330 shares of common stock pursuant to convertible notes that automatically converted when the Company completed its initial public offering. The total of the notes and accrued interest was $1,028,740. The funds were used for working capital.
Purchase of Equity Securities by the Issuer and Affiliated Purchasers
We did not purchase any of our shares of common stock or other securities during our fourth quarter of our fiscal year ended June 30, 2021.
Item 6. Selected Financial Data
As a “smaller reporting company”, the Company is not required to provide the information required by this Item.
Item 7. Management’s Discussion and Analysis of Financial Condition and Results of Operations
You should read the following in conjunction with the sections of this annual report entitled “Cautionary Note Regarding Forward-Looking Statements,” “Risk Factors,” “Summary Historical Consolidated Financial Data,” and “Description of Business,” and the historical consolidated financial statements and the related notes thereto included elsewhere in this annual report. This discussion contains forward-looking statements reflecting current expectations that involve risks and uncertainties. Actual results and the timing of events may differ materially from those contained in these forward-looking statements due to a number of factors, including those discussed in the section entitled “Risk Factors” and elsewhere in this annual report.
| 24 |
| Table of Contents |
Overview
The Company’s consolidated financial statements are prepared in accordance with GAAP. The consolidated financial statements include the accounts of all subsidiaries in which the Company holds a controlling financial interest as of the financial statement date.
The consolidated financial statements for the year ended June 30, 2020 include the accounts of the Company, Trunano Labs, Inc., a Nevada corporation (for which the Company owns 79.4%), and its wholly-owned subsidiaries; Steam Distribution, LLC, a California limited liability company; One Hit Wonder, Inc., a California corporation; Havz, LLC, d/b/a Steam Wholesale, a California limited liability company, One Hit Wonder Holdings, LLC a California limited liability company, SWCH LLC a Delaware limited liability company; and Cresco Management, LLC, a California limited liability company. All intercompany accounts and transactions have been eliminated in consolidation. As of the date of this report, Trunano Labs, Inc. had no operations.
For the year ended June 30, 2021 the consolidated financial statements of Grove, Inc. include the accounts of the Company and its wholly-owned subsidiaries; Trunano Labs, Inc., a Nevada corporation, Steam Distribution, LLC, a California limited liability company; One Hit Wonder, Inc., a California corporation; Havz, LLC, d/b/a Steam Wholesale, a California limited liability company, One Hit Wonder Holdings, LLC a California corporation; SWCH LLC, a Delaware limited liability company; Cresco Management LLC, a California limited liability company, and Infusionz LLC, a Colorado limited liability company. All intercompany accounts and transactions have been eliminated as a result of the consolidation. As of the date of this report, Trunano Labs, Inc. had no operations.
On July 1, 2020, the Company purchased Infusionz LLC, a Colorado limited liability company.
On July 1, 2020, the noncontrolling shareholders of the Company’s subsidiary, Trunano Labs, Inc., converted 1,761,261 shares of Trunano Labs, Inc., stock, representing all the outstanding stock by minority interest holders, into 1,277,778 shares of the Company’s Common Stock. As of July 1, 2020, Trunano Labs, Inc. is a wholly owned subsidiary of Grove Inc.
Operating Segments
The Company’s financial reporting is organized into two segments: products and trade shows for revenue and cost of revenue. The Company’s internal reporting for product sales is organized into three channels of distribution: Grove, Inc. branded products, manufacturing of products to be sold under customers brands and white label products that are sold under customer brands. These product sales are aggregated and viewed by management as one reportable segment due to their similar economic characteristics, products, production, distribution processes and regulatory environment.
Key Factors Affecting Operating Results
Cyclicality and Seasonality
The business does not have seasonality; however, the Company currently only has one trade show, CBD.io, which is held in November each year. Because event revenue is recognized when a particular event is held, the Company experiences fluctuations in quarterly revenue based on the completion of the trade show event. The Company held the November 2019 trade show, however, due to the COVID-19 virus, the November 2020 CBD.io trade show was canceled and our growth strategy in this area has been delayed.
Key Components of Results of Operations
Results of Operations
Year Ended June 30, 2021, as compared to June 30, 2020:
| 25 |
| Table of Contents |
The following summary of our results of operations should be read in conjunction with our consolidated financial statements for the years ended June 30, 2021, and 2020, which are included herein.
|
|
| June 30, |
|
|
|
| ||||||
|
|
| 2021 |
|
| 2020 |
|
| Change |
| |||
| Revenue |
| $ | 24,095,025 |
|
| $ | 7,412,860 |
|
| $ | 16,682,165 |
|
| Cost of revenue |
|
| 12,196,123 |
|
|
| 4,842,897 |
|
|
| 7,353,226 |
|
| Operating Expenses |
|
| 10,472,165 |
|
|
| 7,408,293 |
|
|
| 3,063,872 |
|
| Other expense (income), net |
|
| (269,396 | ) |
|
| 546,542 |
|
|
| (815,938 | ) |
| Net income (loss) |
| $ | 2,978,948 |
|
| $ | (5,384,872 | ) |
| $ | 8,363,820 |
|
Revenues increased by $16,682,165 or 225% for the fiscal year ended June 30, 2021, compared with the fiscal year ended June 30, 2020. $4,134,464 was related to the acquisition of Infusionz LLC on July 1, 2020 and the remaining increase was related to CBD sales in the form of gummies, which has experienced significant growth in the recent months. Included in this growth has been the Company’s own branded products being sold. Infusionz LLC has a similar CBD product line and customer base as the Grove, Inc. This was offset by $1,253,847 decrease in trade show revenue since the show has been canceled during the 2021 fiscal year due to Covid 19. Management expects revenue to increase in the 2021 fiscal year, however, does not expect to have revenue from the annual CBD.io trade show as it has been postponed and management is uncertain when the trade show will be scheduled.
Cost of revenue increased by $7,353,226 or 152% compared with the prior fiscal year. $2,423,755 was related to the acquisition of Infusionz LLC on July 1, 2020, and the remaining amount was related to the increase in revenue. The gross margin improved by approximately 18.9% compared to the prior fiscal year. The primary reason for the gross margin improvement was the overall increase in revenue and the Company’s ability to purchase larger quantities of raw materials at lower prices.
Operating expenses increased by $3,063,872 or 41% compared with the prior fiscal year. $1,457,373 was related to the acquisition of Infusionz LLC on July 1, 2020. The additional increase was attributed to the significant growth in revenue and the requirement to add additional resources to support the current and future growth of the Company. The Company’s management is continuing to control operating expenses while also implementing management growth strategies.
Other expense (income), net increased by $815,938 or 149% compared with the prior fiscal year. During the year ended June 30, 2021, $403,277 was related to the gain on the SBA PPP loan extinguishment and $307,860 was related to the gain on the settlement of lease cancellation. The increases in other income were net of the increase in interest expense of $392,043, which was primarily attributable to the amortization of the beneficial conversion feature on the convertible notes of $342,813.
The Company had net income of $2,978,948 and incurred a net loss of $5,384,872 for the fiscal years ended June 30, 2021 and 2020, respectively. The decrease in the net loss is primarily related to the items noted above and a gain on the change in valuation allowance on deferred tax assets of $1,282,815.
| 26 |
| Table of Contents |
Segment Information
The Company provides the following segments: (a) product segment and (b) trade show segment.
| For the year ended June 30, 2021: |
|
|
|
|
|
| ||||||
|
|
|
|
|
|
|
| ||||||
|
|
| Product |
|
| Trade Show |
|
| Total |
| |||
|
|
|
|
|
|
|
|
|
|
| |||
| Revenue |
| $ | 24,095,025 |
|
| $ | - |
|
| $ | 24,095,025 |
|
| Income from operations |
| $ | 1,426,737 |
|
| $ | - |
|
| $ | 1,426,737 |
|
| Other (income) expense |
| $ | (269,396 | ) |
| $ | - |
|
| $ | (269,396 | ) |
| Depreciation expense |
| $ | 339,052 |
|
| $ | - |
|
| $ | 339,052 |
|
| Income tax expense |
| $ | - |
|
| $ | - |
|
| $ | - |
|
| Segment assets: |
|
|
|
|
|
|
|
|
|
|
|
|
| Additions to property, plant, and equipment |
| $ | 1,422,129 |
|
| $ | - |
|
| $ | 1,422,129 |
|
| Total assets |
| $ | 27,254,564 |
|
| $ | - |
|
| $ | 27,254,564 |
|
|
|
|
|
|
|
|
|
|
|
|
|
|
|
| For the year ended June 30, 2020: |
|
|
|
|
|
|
|
|
|
|
|
|
|
|
|
|
|
|
|
|
|
|
|
|
|
|
|
|
| Product |
|
| Trade Show |
|
| Total |
| |||
|
|
|
|
|
|
|
|
|
|
|
|
|
|
| Revenue |
| $ | 6,159,013 |
|
| $ | 1,253,847 |
|
| $ | 7,412,860 |
|
| Loss from operations |
| $ | (5,083,154 | ) |
| $ | 244,824 |
|
| $ | (4,838,330 | ) |
| Other expense |
| $ | 546,542 |
|
| $ | - |
|
| $ | 546,542 |
|
| Depreciation expense |
| $ | 218,868 |
|
| $ | - |
|
| $ | 218,868 |
|
| Income tax expense |
| $ | - |
|
| $ | - |
|
| $ | - |
|
| Segment assets: |
|
|
|
|
|
|
|
|
|
|
|
|
| Additions to property, plant and equipment |
| $ | 1,929,028 |
|
| $ | - |
|
| $ | 1,929,028 |
|
| Total assets |
| $ | 6,402,205 |
|
| $ | - |
|
| $ | 6,402,205 |
|
Liquidity and Capital Resources
Working Capital
|
|
| As of June 30, 2021 |
|
| As of June 30, 2020 |
| ||
| Current assets |
| $ | 18,293,083 |
|
| $ | 2,649,674 |
|
| Current liabilities |
| $ | 5,819,161 |
|
| $ | 3,519,434 |
|
| Working capital |
| $ | 12,473,922 |
|
| $ | (869,760 | ) |
Cash Flows
|
|
| Years Ended June 30, |
| |||||
|
|
| 2021 |
|
| 2020 |
| ||
| Cash flows provided by (used in) operating activities |
| $ | 2,939,306 |
|
| $ | (4,164,746 | ) |
| Cash flows used in investing activities |
|
| (1,281,007 | ) |
|
| (1,462,915 | ) |
| Cash flows provided by financing activities |
|
| 11,988,395 |
|
|
| 2,817,746 |
|
| Net increase (decrease) in cash during period |
| $ | 13,646,694 |
|
| $ | (2,809,915 | ) |
At June 30, 2021, the Company had cash of $14,534,211 or an increase of $13,646,694 from June 30, 2020. The increase of cash used in operating activities is primarily related to the net income and the sale of the Company common stock.
| 27 |
| Table of Contents |
Net cash used in investing activities for the years ended June 30, 2021, and 2020 was $1,281,007 and $1,462,915, respectively. For the year ended June 30, 2020 the use of cash was primarily due to the net acquisition and sale of equipment. For the year ended June 30, 2021, cash of $62,122 was provided from the acquisition of Infusionz, Inc., $1,422,129 was used to purchase equipment and $79,000 from the sale of property and equipment.
Net cash flows provided by financing activities for the year ended June 30, 2021, was $11,988,395 compared to $2,817,746 for the year ended June 30, 2020. Proceeds from the sale of common stock and sale of the non-controlling interest during the year ended June 30, 2020 for $768,801 and the increase in issuance of notes payable of $2,048,945 compared to proceeds of $1,000,080 from the issuance of convertible notes payable and the proceeds from the issuance of common stock of $10,950,315, net of expenses and the issuance of preferred stock during the year ended June 30, 2021 were the primary reasons for the decrease.
During October of 2019, the Company entered into convertible promissory notes (the “October 2019 Notes”) for total proceeds of $1,500,000. The principal and interest of the October 2019 Notes are payable in full at the maturity date of April 2021, if not previously converted. The October 2019 Notes have an interest rate of 8%, total accrued interest is to be repaid at maturity, and are convertible into common stock if the Company enters an initial public offering arrangement which results in the Company’s common stock becoming listed or trading. The conversion rate was set at $5.00 which is equal to the price of the Company’s common stock sold in the prospectus. On June 29, 2021, the Company issued 348,309 shares of the Company’s common stock for the full payment of principal and interest of these loans.
On April 28, 2020, the Company entered a Paycheck Protection Program loan for $398,945 in connection with COVID-19. The loan and accrued interest amounted to $403,277 which was forgiven on June 11, 2021 and recognized as a gain on the extinguishment of debt.
On May 13, 2020, Infusionz entered a Paycheck Protection Program loan for $297,100 in connection with COVID-19. The is classified as a current liability on the balance sheet on June 30, 2021. The loan and accrued interest amounted to $300,995 and was forgiven on August 30, 2021.
On June 3, 2020, the Company entered a loan for $150,000 with the Small Business Administration. The promissory note as a fixed payment schedule commencing on June 3, 2021, consisting of principal and interest payments of $731 monthly. The balance of the principal of $150,000 and interest of $6,876 was paid on August 30, 2021 and classified as a current liability on the balance sheet at June 30, 2021.
During December 2020, the Company entered into a note agreement for total proceeds of $750,000 with the Chief Executive Officer of the Company, a related party. The principal and interest of the note is payable was repaid during the year ended June 30, 2021.
During the year ended June 30, 2021, the Company entered into convertible promissory notes (the “March 2021 Notes”) for total proceeds of $1,000,080. The term of the March 2021 Notes is two years and bear interest at a rate 8% per annum, compounded annually. The principal amount and accrued interest of the March 2021 Notes are automatically converted into capital stock of the company upon an initial public offering by the Company at a rate of seventy five percent of the initial public offering price of the shares of capital stock of the Company sold in the initial public offering. As of June 30, 2021, all of these notes have been converted to common stock.
In December 2019, a novel strain of coronavirus (COVID-19) surfaced. The spread of COVID-19 around the world has caused significant volatility in U.S. and international markets. There is significant uncertainty around the breadth and duration of business disruptions related to COVID-19, as well as its impact on the U.S. and international economies and, as such, the Company has transition to a combination of work from home and social distancing operations and there has been minimal impact to our internal operations from the transition. The Company is unable to determine if there will be a material future impact to its customers’ operations and ultimately an impact to the Company’s overall revenues.
| 28 |
| Table of Contents |
Off-Balance Sheet Arrangements
The Company has no off-balance sheet arrangements that have or are reasonably likely to have a current or future effect on its financial condition, changes in financial condition, revenues or expenses, results of operations, liquidity, capital expenditures or capital resources that is material to stockholders.
Critical Accounting Policies
The discussion and analysis of our financial condition and results of operations are based on our consolidated financial statements, which have been prepared in accordance with accounting principles generally accepted in the United States of America (GAAP). The preparation of these consolidated financial statements requires us to make estimates and judgments that affect the reported amounts of assets, liabilities, revenues and expenses, and related disclosure of contingent assets and liabilities. On an on-going basis, we evaluate these estimates, including those related to bad debts, intangible assets, and litigation. We base our estimates on historical experience and on various other assumptions that are believed to be reasonable under the circumstances, the results of which form the basis for making judgments about the carrying values of certain assets and liabilities. Actual results may differ from these estimates under different assumptions or conditions.
We have identified below the accounting policies, related to what we believe are most critical to our business operations and are discussed throughout Management’s Discussion and Analysis of Financial Condition or Plan of Operation where such policies affect our reported and expected financial results.
Use of Estimates - The preparation of financial statements in conformity with accounting principles generally accepted in the United States of America requires management to make estimates and assumptions that affect the reported amounts of assets and liabilities and disclosure of contingent assets and liabilities at the date of the financial statements and the reported amounts of revenues and expenses during the reporting period. Actual results could differ from those estimates.
Significant estimates underlying the Company’s reported financial position and results of operations include the allowance for doubtful accounts, useful lives of property and equipment, impairment of long-lived assets, inventory valuation, fair value of stock-based compensation and valuation allowance on deferred tax assets.
Business Combinations -The Company accounts for its business combinations using the acquisition method of accounting. The cost of an acquisition is measured as the aggregate of the acquisition date fair values of the assets transferred and liabilities assumed by the Company to the seller’s cash consideration and equity instruments issued. Transaction costs directly attributable to the acquisition are expensed as incurred. The excess of (i) the total costs of acquisition over (ii) the fair value of the identifiable net assets of the acquiree is recorded as identifiable intangible assets and goodwill.
Goodwill - The Company evaluates its goodwill for possible impairment as prescribed by ASC 350-20-35, Intangibles — Goodwill and Other (Topic 350), Simplifying the Test for Goodwill Impairment at least annually and when one or more triggering events or circumstances indicate that the goodwill might be impaired. Under this guidance, annual or interim goodwill impairment testing is performed by comparing the estimated fair value of a reporting unit with its carrying amount. An impairment charge is recognized for the amount by which the carrying amount exceeds the reporting unit’s fair value, not to exceed the carrying value of goodwill.
The Company performed its annual test as of June 30, 2021. No impairment charge was identified in connection with the annual goodwill impairment test
Revenue Recognition - The Company has adopted the new revenue recognition guidelines in accordance with ASC 606, Revenue from Contracts with Customers (ASC 606), commencing from the period under this report. The Company analyzes its contracts to assess that they are within the scope and in accordance with ASC 606. In determining the appropriate amount of revenue to be recognized as the Company fulfills its obligations under each of its agreements, whether for goods and services or licensing, the Company performs the following steps: (i) identification of the promised goods or services in the contract; (ii) determination of whether the promised goods or services are performance obligations including whether they are distinct in the context of the contract; (iii) measurement of the transaction price, including the constraint on variable consideration; (iv) allocation of the transaction price to the performance obligations based on estimated selling prices; and (v) recognition of revenue when (or as) the Company satisfies each performance obligation. The Company acts as a principal in its revenue transactions as the Company is the primary obligor in the transactions. Generally, the Company recognizes revenue for its products upon shipment to customers, provided no significant obligations remain and collection is probable.
| 29 |
| Table of Contents |
Product Revenue - Most of the Company’s revenue contracts are from domestic sales and represent a single performance obligation related to the fulfillment of customer orders for the purchase of its products. Net sales reflect the transaction prices for these contracts based on the Company’s selling list price, which is then reduced by estimated costs for trade promotional programs, consumer incentives, and allowances and discounts used to incentivize sales growth and build brand awareness.
The Company recognizes revenue at the point in time that control of the ordered product is transferred to the customer, which is upon shipment to the customer or other customer-designated delivery point. Taxes collected from customers that are remitted to governmental agencies are accounted for on a net basis and not included as revenue.
The Company does not accept sales returns from wholesale customers unless the sales return was pre-approved prior to production and shipment. E-Commerce product returns must be completed within 45 days of the date of purchase. The Company does not accrue for estimated sales returns as historical sales returns have been minimal. The Company records deferred revenues when cash payments are received or due in advance of performance, including amounts which are refundable. Substantially all the deferred revenue as of June 30, 2020, was recognized as revenue in the year ended June 30, 2021.
Shipping and handling fees billed to customers are included in revenue. Shipping and handling fees associated with freight are generally included in cost of revenue.
Trade Show Revenue - A significant portion of the Company’s annual revenue is generated from the production of a single trade show. The revenue includes booth space sales, registration fees and sponsorship fees. The Company recognizes revenue upon completion of the CBD.IO trade show. Amounts invoiced prior to the completion of the trade show are recorded as deferred revenue in the consolidated Balance Sheets until the completion of the event. As of June 30, 2021, and 2020, the Company had no deferred revenue related to trade show business.
Impairment of Long-lived Assets - Long-lived assets are reviewed for impairment whenever events or changes in circumstances indicate that the book value of the asset may not be recoverable. The Company periodically evaluates whether events and circumstances have occurred that indicate possible impairment. When impairment indicators exist, the Company estimates the future undiscounted net cash flows of the related asset or asset group over the remaining life in measuring whether or not the asset values are recoverable. The Company did not recognize impairment on its long-lived assets during the years ended June 30, 2021, or 2020.
Stock Based Compensation - The Company recognizes all share-based payments to employees, including grants of employee stock options, as compensation expense in the financial statements based on their fair values. That expense will be recognized over the period during which an employee is required to provide services in exchange for the award, known as the requisite service period (usually the vesting period) or immediately if the share-based payments vest immediately.
Inventory - The Company reviews the inventory level of all products and raw materials quarterly. For most products that have been in the market for one year or greater, we consider inventory levels of greater than one year’s sales to be excess or other items that show slower than projected sales. Due to limited market penetration for our products, we have decided to write down 50% of the cost against certain raw materials and finished products. Products that are no longer part of the current product offering are considered obsolete. The potential for re-sale of slow-moving and obsolete inventories is based upon our assumptions about future demand and market conditions. The recorded cost of obsolete inventories is then reduced to zero and the slow-moving and obsolete inventory is written off and are recorded as charges to cost of goods sold. All adjustments for obsolete inventory establish a new cost basis for that inventory as we believe such reductions are permanent declines in the market price of our products. Generally, obsolete inventory is sold to companies that specialize in the liquidation, while we continue to market slow-moving inventories until they are sold or become obsolete. As obsolete or slow-moving inventory is sold or disposed of, we write it off.
| 30 |
| Table of Contents |
Non-GAAP Measures (unaudited)
| Reconciliation of Non-GAAP Adjusted EBITDA to GAAP Net Income (Net Loss) | ||||||||
| Year Ended June 30, | ||||||||
|
|
|
|
|
| ||||
|
|
| 2021 |
|
| 2020 |
| ||
| Net income (Net loss) GAAP |
| $ | 2,978,948 |
|
| $ | (5,383,673 | ) |
| Income tax |
|
| (1,282,815 | ) |
|
| - |
|
| Interest expense, net |
|
| 530,449 |
|
|
| 138,406 |
|
| Depreciation and amortization |
|
| 1,030,021 |
|
|
| 611,346 |
|
| Stock compensation |
|
| 738,932 |
|
|
| 372,770 |
|
| Impairment of lease cancellation |
|
| - |
|
|
| 588,347 |
|
| Gain on lease settlement |
|
| (387,860 | ) |
|
| - |
|
| Gain on SBA PPP loan extinguishment |
|
| (403,277 | ) |
|
| - |
|
| Gain on sale of asset |
|
| (8,708 | ) |
|
| (180,211 | ) |
| Non-GAAP adjusted EBITDA |
| $ | 3,195,690 |
|
| $ | (3,853,015 | ) |
Use of Non-GAAP Financial Measures
The Company discloses and uses the above-mentioned non-GAAP financial measures internally as a supplement to GAAP financial information to evaluate its operating performance, for financial planning purposes, to establish operational goals, for compensation plans, to measure debt service capability, for capital expenditure planning and to determine working capital needs and believes that these are useful financial measures also used by investors. Non-GAAP adjusted EBITDA is defined as GAAP net income or net loss before interest, taxes, depreciation and amortization (EBITDA) adjusted for the non-cash stock compensation and stock option expense, acquisition, integration & restructuring expenses, charges and gains or losses from extinguishment of debt and other non-cash items. Non-GAAP EBITDA and non-GAAP adjusted EBITDA are not terms defined by GAAP and, as a result, the Company’s measure of non-GAAP EBITDA and non-GAAP adjusted EBITDA might not be comparable to similarly titled measures used by other companies. Generally, a non-GAAP financial measure is a numerical measure of a company’s performance, financial position, or cash flow that either excludes or includes amounts that are not normally included in the most directly comparable measure calculated and presented in accordance with GAAP. The non-GAAP financial measures discussed above, however, should be considered in addition to, and not as a substitute for, or superior to net income or net loss as reported for GAAP on the Consolidated Statements of Operations, cash and cash flows on the Consolidated Statement of Cash Flows or other measures of financial performance prepared in accordance with GAAP, and as reflected on the Company’s financial statements prepared in accordance with GAAP. These non-GAAP financial measures are not a substitute for or presented in lieu of financial measures provided by GAAP and all measures and disclosures of financial information pursuant to GAAP should be read to obtain a comprehensive and thorough understanding of the Company’s financial results. The reconciliations of non-GAAP EBITDA and non-GAAP adjusted EBITDA to GAAP operating income (loss) and/or GAAP net income (net loss) referred to in the highlights or elsewhere are provided in the schedules that are a part of this document.
Item 7A. Quantitative and Qualitative Disclosures About Market Risk
As a “smaller reporting company”, the Company is not required to provide the information required by this Item.
| 31 |
| Table of Contents |
Item 8. Financial Statements and Supplementary Data
GROVE INC.
INDEX TO CONSOLIDATED FINANCIAL STATEMENTS
YEARS ENDED JUNE 30, 2021 AND 2020
|
|
|
Page |
|
|
|
|
|
|
|
| F-1 |
| |
|
|
|
|
|
| Consolidated Financial Statements |
|
|
|
|
|
|
|
|
|
| F-2 |
| |
|
|
|
|
|
|
| F-3 |
| |
|
|
|
|
|
|
| F-4 |
| |
|
|
|
|
|
|
| F-5 |
| |
|
|
|
|
|
|
| F-6 |
|
| 32 |
| Table of Contents |
REPORT OF INDEPENDENT REGISTERED PUBLIC ACCOUNTING FIRM
To the shareholders and the board of directors of Grove, Inc.
Opinion on the Financial Statements
We have audited the accompanying consolidated balance sheets of Grove, Inc. (“the Company”) as of June 30, 2021 and 2020, and the related consolidated statements of operations, stockholders’ equity, and cash flows for each of the two years in the period ended June 30, 2021, and the related notes (collectively referred to as the “financial statements”). In our opinion, the financial statements referred to above present fairly, in all material respects, the financial position of Grove, Inc. as of June 30, 2021 and 2020, and the results of its operations and its cash flows for each of the two years in the period ended June 30, 2021, in conformity with accounting principles generally accepted in the United States of America.
Basis for Opinion
These financial statements are the responsibility of the Company’s management. Our responsibility is to express an opinion on the Company’s financial statements based on our audits. We are a public accounting firm registered with the Public Company Accounting Oversight Board (United States) (“PCAOB”) and are required to be independent with respect to the Company in accordance with the U.S. federal securities laws and the applicable rules and regulations of the Securities and Exchange Commission and the PCAOB.
We conducted our audits in accordance with standards of the PCAOB. Those standards require that we plan and perform the audit to obtain reasonable assurance about whether the financial statements are free of material misstatement, whether due to error or fraud. The Company is not required to have, nor were we engaged to perform, an audit of its internal control over financial reporting. As part of our audit we are required to obtain an understanding of internal control over financial reporting but not for the purpose of expressing an opinion on the effectiveness of the Company’s internal control over financial reporting. Accordingly, we express no such opinion.
Our audits included performing procedures to assess the risks of material misstatement of the financial statements, whether due to error or fraud, and performing procedures that respond to those risks. Such procedures included examining, on a test basis, evidence regarding the amounts and disclosures in the financial statements. Our audits also included evaluating the accounting principles used and significant estimates made by management, as well as evaluating the overall presentation of financial statements. We believe that our audits provide a reasonable basis for our opinion.
/s/ B F Borgers CPA PC
We have served as the Company’s auditor since 2020.
Lakewood, Colorado
September 28, 2021
| F-1 |
| Table of Contents |
| GROVE INC |
|
|
| June 30, |
|
| June 30, |
| ||
|
|
| 2021 |
|
| 2020 |
| ||
|
|
|
|
|
|
|
| ||
| ASSETS |
|
|
|
|
|
| ||
| Current assets |
|
|
|
|
|
| ||
| Cash |
| $ | 14,534,211 |
|
| $ | 887,517 |
|
| Accounts receivable, net of allowance for doubtful accounts of $57,500 and $10,000, respectively |
|
| 1,277,662 |
|
|
| 165,147 |
|
| Inventory |
|
| 2,094,952 |
|
|
| 1,448,448 |
|
| Prepaid expenses and other current assets |
|
| 386,258 |
|
|
| 148,562 |
|
| Total current assets |
|
| 18,293,083 |
|
|
| 2,649,674 |
|
|
|
|
|
|
|
|
|
|
|
| Property and equipment, net |
|
| 2,832,400 |
|
|
| 1,687,273 |
|
| Intangible assets, net |
|
| 1,845,166 |
|
|
| 1,240,260 |
|
| Goodwill |
|
| 2,413,813 |
|
|
| 493,095 |
|
| Deferred tax asset |
|
| 1,403,591 |
|
|
| - |
|
| Other assets |
|
| 49,068 |
|
|
| 37,068 |
|
| Right-of-use asset |
|
| 417,443 |
|
|
| 294,835 |
|
| Total other assets |
|
| 8,961,481 |
|
|
| 3,752,531 |
|
|
|
|
|
|
|
|
|
|
|
| Total assets |
| $ | 27,254,564 |
|
| $ | 6,402,205 |
|
|
|
|
|
|
|
|
|
|
|
| LIABILITIES AND STOCKHOLDERS' EQUITY |
|
|
|
|
|
|
|
|
| Current liabilities |
|
|
|
|
|
|
|
|
| Accounts payable |
| $ | 1,604,723 |
|
| $ | 484,333 |
|
| Accrued compensation |
|
| 1,020,936 |
|
|
| 195,399 |
|
| Deferred revenue |
|
| 485,973 |
|
|
| 473,320 |
|
| Accrued liabilities |
|
| 296,021 |
|
|
| 221,664 |
|
| Acquisition payable |
|
| 1,764,876 |
|
|
| - |
|
| Current portion of notes payable |
|
| 447,100 |
|
|
| 183,595 |
|
| Convertible notes payable |
|
| - |
|
|
| 1,500,000 |
|
| Current portion of operating lease payable |
|
| 199,532 |
|
|
| 461,123 |
|
| Total current liabilities |
|
| 5,819,161 |
|
|
| 3,519,434 |
|
|
|
|
|
|
|
|
|
|
|
| Notes payable, net of current portion |
|
| - |
|
|
| 365,350 |
|
| Operating lease payable, net of current portion |
|
| 217,430 |
|
|
| 338,040 |
|
| Total long-term liabilities |
|
| 217,430 |
|
|
| 703,390 |
|
|
|
|
|
|
|
|
|
|
|
| Commitments and contingencies |
|
| - |
|
|
| - |
|
|
|
|
|
|
|
|
|
|
|
| Stockholders' equity |
|
|
|
|
|
|
|
|
| Preferred stock, $0.001 par value, 100,000,000 shares authorized, and 500,000 and 0 shares issued and outstanding, respectively |
|
| 500 |
|
|
| - |
|
| Common stock, $0.001 par value, 100,000,000 shares authorized, and 15,262,394 and 10,222,223 shares issued and outstanding, respectively |
|
| 15,262 |
|
|
| 10,223 |
|
| Additional paid in capital |
|
| 25,372,247 |
|
|
| 7,314,341 |
|
| Accumulated deficit |
|
| (4,170,036 | ) |
|
| (7,098,984 | ) |
| Total stockholders' equity attributable to Grove, Inc. |
|
| 21,217,973 |
|
|
| 225,580 |
|
| Non-controlling interest in subsidiary |
|
| - |
|
|
| 1,953,801 |
|
| Total stockholders' equity |
|
| 21,217,973 |
|
|
| 2,179,381 |
|
|
|
|
|
|
|
|
|
|
|
| Total liabilities and stockholders' equity |
| $ | 27,254,564 |
|
| $ | 6,402,205 |
|
The accompanying notes are an integral part of these consolidated financial statements.
| F-2 |
| Table of Contents |
| GROVE INC |
|
|
| Year Ended June 30, |
| |||||
|
|
| 2021 |
|
| 2020 |
| ||
|
|
|
|
|
|
|
| ||
| Revenue |
|
|
|
|
|
| ||
| Product revenue |
|
| 24,095,025 |
|
|
| 6,159,013 |
|
| Trade show revenue |
|
| - |
|
|
| 1,253,847 |
|
|
|
|
| 24,095,025 |
|
|
| 7,412,860 |
|
|
|
|
|
|
|
|
|
|
|
| Product costs |
|
| 12,196,123 |
|
|
| 4,280,909 |
|
| Trade show costs |
|
| - |
|
|
| 561,988 |
|
|
|
|
| 12,196,123 |
|
|
| 4,842,897 |
|
|
|
|
|
|
|
|
|
|
|
| Gross profit |
|
| 11,898,902 |
|
|
| 2,569,963 |
|
|
|
|
|
|
|
|
|
|
|
| Operating expenses |
|
|
|
|
|
|
|
|
| Sales and marketing |
|
| 2,388,211 |
|
|
| 1,370,964 |
|
| General and administrative expenses |
|
| 8,083,954 |
|
|
| 6,037,329 |
|
|
|
|
| 10,472,165 |
|
|
| 7,408,293 |
|
|
|
|
|
|
|
|
|
|
|
| Income (loss) from operations |
|
| 1,426,737 |
|
|
| (4,838,330 | ) |
|
|
|
|
|
|
|
|
|
|
| Other expense (income), net |
|
|
|
|
|
|
|
|
| Interest expense (income), net |
|
| 530,449 |
|
|
| 138,406 |
|
| Gain on sale of assets |
|
| (8,708 | ) |
|
| (180,211 | ) |
| Gain on SBA PPP loan extinguishment |
|
| (403,277 | ) |
|
| - |
|
| Settlement of cancelled lease |
|
| (387,860 | ) |
|
| - |
|
| Impairment of cancelled lease expense |
|
| - |
|
|
| 588,347 |
|
|
|
|
|
|
|
|
|
|
|
| Other expense (income), net |
|
| (269,396 | ) |
|
| 546,542 |
|
|
|
|
|
|
|
|
|
|
|
| Income (loss) before income tax |
|
| 1,696,133 |
|
|
| (5,384,872 | ) |
|
|
|
|
|
|
|
|
|
|
| Income tax benefit (expense) |
| 1,282,815 |
|
|
| - |
| |
|
|
|
|
|
|
|
|
|
|
| Net income (loss) |
|
| 2,978,948 |
|
|
| (5,384,872 | ) |
| Net loss attributable to noncontrolling interest |
|
| - |
|
|
| (1,199 | ) |
| Deemed dividend related to the issuance of Series A Preferred Stock |
|
| (50,000 | ) |
|
| - |
|
| Net income (loss) attributable to Grove, Inc. |
| $ | 2,928,948 |
|
| $ | (5,383,673 | ) |
|
|
|
|
|
|
|
|
|
|
| Basic income (loss) per share |
| $ | 0.25 |
|
| $ | (0.53 | ) |
|
|
|
|
|
|
|
|
|
|
| Diluted income (loss) per share |
| $ | 0.21 |
|
| $ | (0.53 | ) |
|
|
|
|
|
|
|
|
|
|
| Weighted average shares outstanding |
|
| 11,930,378 |
|
|
| 10,097,075 |
|
|
|
|
|
|
|
|
|
|
|
| Fully diluted weighted average shares outstanding |
|
| 14,257,934 |
|
|
| 10,097,075 |
|
The accompanying notes are an integral part of these consolidated financial statements.
| F-3 |
| Table of Contents |
| GROVE INC |
|
|
|
|
|
|
|
|
|
|
|
|
|
|
|
|
|
|
|
|
|
|
|
|
|
| ||||||||
|
|
| Preferred Stock |
|
| Preferred Stock |
|
| Common Stock |
|
| Common Stock |
|
| Additional Paid |
|
| Accumulated |
|
| Non-controlling |
|
| Total Shareholders' |
| ||||||||
|
|
| Shares |
|
| Par |
|
| Shares |
|
| Par |
|
| In Capital |
|
| Deficit |
|
| Interest |
|
| Equity |
| ||||||||
|
|
|
|
|
|
|
|
|
|
|
|
|
|
|
|
|
|
|
|
|
|
|
|
|
| ||||||||
| 2020 |
|
|
|
|
|
|
|
|
|
|
|
|
|
|
|
|
|
|
|
|
|
|
|
| ||||||||
| Balance, June 30, 2019 |
|
| 500,000 |
|
| $ | 500 |
|
|
| 9,653,595 |
|
| $ | 9,654 |
|
| $ | 6,446,640 |
|
| $ | (1,715,311 | ) |
| $ | 1,655,000 |
|
| $ | 6,396,483 |
|
|
|
|
|
|
|
|
|
|
|
|
|
|
|
|
|
|
|
|
|
|
|
|
|
|
|
|
|
|
|
|
|
|
|
| Conversion of preferred stock to common stock for cash |
|
| (500,000 | ) |
|
| (500 | ) |
|
| 277,778 |
|
|
| 278 |
|
|
| 50,222 |
|
|
| - |
|
|
| - |
|
|
| 50,000 |
|
|
|
|
|
|
|
|
|
|
|
|
|
|
|
|
|
|
|
|
|
|
|
|
|
|
|
|
|
|
|
|
|
|
|
| Trunano subsidiary stock issued for cash |
|
| - |
|
|
| - |
|
|
| - |
|
|
| - |
|
|
| - |
|
|
| - |
|
|
| 300,000 |
|
|
| 300,000 |
|
|
|
|
|
|
|
|
|
|
|
|
|
|
|
|
|
|
|
|
|
|
|
|
|
|
|
|
|
|
|
|
|
|
|
| Stock based compensation |
|
| - |
|
|
| - |
|
|
| - |
|
|
| - |
|
|
| 372,770 |
|
|
| - |
|
|
| - |
|
|
| 372,770 |
|
|
|
|
|
|
|
|
|
|
|
|
|
|
|
|
|
|
|
|
|
|
|
|
|
|
|
|
|
|
|
|
|
|
|
| Common stock issued for cash |
|
| - |
|
|
| - |
|
|
| 290,850 |
|
|
| 291 |
|
|
| 444,709 |
|
|
| - |
|
|
|
|
|
|
| 445,000 |
|
|
|
|
|
|
|
|
|
|
|
|
|
|
|
|
|
|
|
|
|
|
|
|
|
|
|
|
|
|
|
|
|
|
|
| Net loss |
|
| - |
|
|
| - |
|
|
| - |
|
|
| - |
|
|
| - |
|
|
| (5,383,673 | ) |
|
| (1,199 | ) |
|
| (5,384,872 | ) |
|
|
|
|
|
|
|
|
|
|
|
|
|
|
|
|
|
|
|
|
|
|
|
|
|
|
|
|
|
|
|
|
|
|
| Balance, June 30, 2020 |
|
| - |
|
| $ | - |
|
|
| 10,222,223 |
|
| $ | 10,223 |
|
| $ | 7,314,341 |
|
| $ | (7,098,984 | ) |
| $ | 1,953,801 |
|
| $ | 2,179,381 |
|
|
|
|
|
|
|
|
|
|
|
|
|
|
|
|
|
|
|
|
|
|
|
|
|
|
|
|
|
|
|
|
|
|
|
| 2021 |
|
|
|
|
|
|
|
|
|
|
|
|
|
|
|
|
|
|
|
|
|
|
|
|
|
|
|
|
|
|
|
|
| Balance, June 30, 2020 |
|
| - |
|
| $ | - |
|
|
| 10,222,223 |
|
| $ | 10,223 |
|
| $ | 7,314,341 |
|
| $ | (7,098,984 | ) |
| $ | 1,953,801 |
|
| $ | 2,179,381 |
|
|
|
|
|
|
|
|
|
|
|
|
|
|
|
|
|
|
|
|
|
|
|
|
|
|
|
|
|
|
|
|
|
|
|
| Conversion of Trunano subsidiary stock into Grove common stock |
|
| - |
|
|
| - |
|
|
| 1,277,778 |
|
|
| 1,278 |
|
|
| 1,952,523 |
|
|
| - |
|
|
| (1,953,801 | ) |
|
| - |
|
|
|
|
|
|
|
|
|
|
|
|
|
|
|
|
|
|
|
|
|
|
|
|
|
|
|
|
|
|
|
|
|
|
|
| Issuance of common stock for acquisition |
|
| - |
|
|
| - |
|
|
| 526,415 |
|
|
| 525 |
|
|
| 1,234,599 |
|
|
| - |
|
|
| - |
|
|
| 1,235,124 |
|
|
|
|
|
|
|
|
|
|
|
|
|
|
|
|
|
|
|
|
|
|
|
|
|
|
|
|
|
|
|
|
|
|
|
| Issuance of common stock for acquisition costs |
|
| - |
|
|
| - |
|
|
| 83,334 |
|
|
| 83 |
|
|
| 127,417 |
|
|
| - |
|
|
| - |
|
|
| 127,500 |
|
|
|
|
|
|
|
|
|
|
|
|
|
|
|
|
|
|
|
|
|
|
|
|
|
|
|
|
|
|
|
|
|
|
|
| Stock based compensation |
|
| - |
|
|
| - |
|
|
| - |
|
|
| - |
|
|
| 611,432 |
|
|
| - |
|
|
| - |
|
|
| 611,432 |
|
|
|
|
|
|
|
|
|
|
|
|
|
|
|
|
|
|
|
|
|
|
|
|
|
|
|
|
|
|
|
|
|
|
|
| Issuance of common stock for cash |
|
| - |
|
|
| - |
|
|
| 2,530,000 |
|
|
| 2,530 |
|
|
| 10,947,785 |
|
|
| - |
|
|
| - |
|
|
| 10,950,315 |
|
|
|
|
|
|
|
|
|
|
|
|
|
|
|
|
|
|
|
|
|
|
|
|
|
|
|
|
|
|
|
|
|
|
|
| Issuance of common stock for conversion of notes payable and accrued interest |
|
| - |
|
|
| - |
|
|
| 622,644 |
|
|
| 623 |
|
|
| 3,084,650 |
|
|
| - |
|
|
| - |
|
|
| 3,085,273 |
|
|
|
|
|
|
|
|
|
|
|
|
|
|
|
|
|
|
|
|
|
|
|
|
|
|
|
|
|
|
|
|
|
|
|
| Issuance of preferred stock for cash |
|
| 500,000 |
|
|
| 500 |
|
|
| - |
|
|
| - |
|
|
| 49,500 |
|
|
| - |
|
|
| - |
|
|
| 50,000 |
|
|
|
|
|
|
|
|
|
|
|
|
|
|
|
|
|
|
|
|
|
|
|
|
|
|
|
|
|
|
|
|
|
|
|
| Deemed dividend for Series A preferred stock issuance |
|
| - |
|
|
| - |
|
|
| - |
|
|
| - |
|
|
| 50,000 |
|
|
| (50,000 | ) |
|
| - |
|
|
| - |
|
|
|
|
|
|
|
|
|
|
|
|
|
|
|
|
|
|
|
|
|
|
|
|
|
|
|
|
|
|
|
|
|
|
|
| Net income |
|
| - |
|
|
| - |
|
|
| - |
|
|
| - |
|
|
| - |
|
|
| 2,978,948 |
|
|
| - |
|
|
| 2,978,948 |
|
|
|
|
|
|
|
|
|
|
|
|
|
|
|
|
|
|
|
|
|
|
|
|
|
|
|
|
|
|
|
|
|
|
|
| Balance, June 30, 2021 |
|
| 500,000 |
|
| $ | 500 |
|
|
| 15,262,394 |
|
| $ | 15,262 |
|
| $ | 25,372,247 |
|
| $ | (4,170,036 | ) |
| $ | - |
|
| $ | 21,217,973 |
|
The accompanying notes are an integral part of these consolidated financial statements.
| F-4 |
| Table of Contents |
| GROVE INC |
|
|
| Year Ended June 30, |
| |||||
|
|
| 2021 |
|
| 2020 |
| ||
| Cash flows from operating activities |
|
|
|
|
|
| ||
| Net income (loss) |
| $ | 2,978,948 |
|
| $ | (5,383,673 | ) |
| Adjustments to reconcile net loss to net cash provided by (used in) operating activities: |
|
|
|
|
|
|
|
|
| Depreciation and amortization |
|
| 1,030,021 |
|
|
| 611,346 |
|
| Inventory write-offs |
|
| 375,000 |
|
|
| - |
|
| Gain on change in deferred tax allowance |
|
| (1,282,815 | ) |
|
|
|
|
| Gain on settlement of cancelled lease |
|
| (387,860 | ) |
|
| - |
|
| Impairment on leased asset |
|
| - |
|
|
| 588,347 |
|
| Amortization of beneficial conversion feature on convertible notes |
|
| 342,813 |
|
|
| - |
|
| Shares issued for services |
|
| 127,500 |
|
|
| - |
|
| Bad debt expense |
|
| 78,185 |
|
|
| 160,740 |
|
| Gain on sale of equipment |
|
| (8,708 | ) |
|
| (180,211 | ) |
| Gain on forgiveness of SBA PPP loan |
|
| (403,277 | ) |
|
| - |
|
| Stock based compensation |
|
| 611,432 |
|
|
| 372,770 |
|
| Changes in assets and liabilities, net of acquired amounts |
|
|
|
|
|
|
|
|
| Accounts receivable |
|
| (1,138,228 | ) |
|
| (95,665 | ) |
| Other receivables |
|
| - |
|
|
| (154,500 | ) |
| Inventory |
|
| (846,659 | ) |
|
| (310,384 | ) |
| Prepaid expenses and other current assets |
|
| (313,206 | ) |
|
| 18,346 |
|
| Accounts payable and accrued liabilities |
|
| 1,966,806 |
|
|
| 277,979 |
|
| Accrued liabilities related to acquisition |
|
| (90,876 | ) |
|
| (287,528 | ) |
| Deferred revenue |
|
| (99,770 | ) |
|
| 217,687 |
|
| Net cash provided by (used in) operating activities |
|
| 2,939,306 |
|
|
| (4,164,746 | ) |
|
|
|
|
|
|
|
|
|
|
| Cash flows from investing activities |
|
|
|
|
|
|
|
|
| Acquisition of Infusionz, Inc., net of cash acquired |
|
| 62,122 |
|
|
| - |
|
| Proceeds from sale of property and equipment |
|
| 79,000 |
|
|
| 466,113 |
|
| Acquisition of property and equipment |
|
| (1,422,129 | ) |
|
| (1,929,028 | ) |
| Net cash used in investing activities |
|
| (1,281,007 | ) |
|
| (1,462,915 | ) |
|
|
|
|
|
|
|
|
|
|
| Cash flows from financing activities |
|
|
|
|
|
|
|
|
| Proceeds from issuance of common stock |
|
| 10,950,315 |
|
|
| 420,000 |
|
| Proceeds from issuance of common stock for conversion of preferred stock |
|
| - |
|
|
| 50,000 |
|
| Proceeds from issuance of non-controlling interest |
|
| - |
|
|
| 298,801 |
|
| Proceeds from issuance of preferred stock |
|
| 50,000 |
|
|
| - |
|
| Proceeds from issuance of related party note payable |
|
| 750,000 |
|
|
| - |
|
| Repayment of related party note payable |
|
| (750,000 | ) |
|
| - |
|
| Payment of note payable |
|
| (12,000 | ) |
|
| - |
|
| Proceeds from issuance of notes payable |
|
| 1,000,080 |
|
|
| 2,048,945 |
|
| Net cash provided by financing activities |
|
| 11,988,395 |
|
|
| 2,817,746 |
|
|
|
|
|
|
|
|
|
|
|
| Net increase (decrease) in cash |
|
| 13,646,694 |
|
|
| (2,809,915 | ) |
| Cash, beginning of period |
|
| 887,517 |
|
|
| 3,697,432 |
|
| Cash, end of period |
| $ | 14,534,211 |
|
| $ | 887,517 |
|
|
|
|
|
|
|
|
|
|
|
| Supplemental cash flow disclosures |
|
|
|
|
|
|
|
|
| Interest paid |
| $ | - |
|
| $ | 2,521 |
|
| Income tax paid |
| $ | - |
|
| $ | - |
|
| Non-cash financing activities |
|
|
|
|
|
|
|
|
| Issuance of common stock for acquisition of Infusionz |
| $ | 650,255 |
|
| $ | - |
|
| Issuance of common stock for conversion of notes payable and accrued interest |
| $ | 3,085,273 |
|
| $ | - |
|
| Repayment of Infusionz LLC debt to Grove, Inc. |
| $ | 72,000 |
|
| $ | - |
|
| Liabilities assumed from acquisition of Infusionz |
| $ | (680,480 | ) |
| $ | - |
|
| Stock issuance for payroll accrual |
| $ | - |
|
| $ | 25,000 |
|
The accompanying notes are an integral part of these consolidated financial statements.
| F-5 |
| Table of Contents |
Grove Inc.
Notes to the Consolidated Financial Statements
June 30, 2021 and 2020
Note 1. Background Information
We are in the business of developing, producing, marketing, and selling raw materials, white label products and end consumer products containing the hemp plant extract, Cannabidiol (“CBD”). We sell to numerous consumer markets including the nutraceutical, beauty care, pet care and functional food sectors. We seek to take advantage of an emerging worldwide trend to re-energize the production of industrial hemp and to foster its many uses for consumers.
In addition, we are an operator of an annual tradeshow in the United States related to the CBD industry. The Company only has one trade show, CBD.IO, which is held in November each year. Because event revenue is recognized when a particular event is held, the Company experiences fluctuations in quarterly revenue based on the completion of the trade show event.
Grove Inc. (the “Company”) is a Nevada Corporation and has eight wholly owned subsidiaries, Trunano Labs, Inc., a Nevada corporation, Cresco Management, a California corporation, Steam Distribution, LLC, a California limited liability company; One Hit Wonder, Inc., a California corporation; Havz, LLC, d/b/a Steam Wholesale, a California limited liability company, and One Hit Wonder Holdings, LLC a California corporation, Infusionz LLC, a Colorado corporation and SWCH, a Delaware corporation.
On July 1, 2020, the noncontrolling shareholders of the Company’s subsidiary, Trunano Labs Inc., converted 1,761,261 shares of Trunano Labs, Inc. stock, representing all the outstanding stock by minority interest holders, into 1,277,778 shares of Grove Inc. common stock, 10.8% of the then outstanding shares. As of July 1, 2020, Trunano Labs, Inc. is a wholly owned subsidiary of Grove Inc.
On July 1, 2020, the Company entered into an agreement and plan of merger with Infusionz LLC (the “Infusionz Agreement”) with the members of Infusionz LLC. Pursuant to the terms of the Infusionz Agreement, on July 1, 2020, the Company acquired 100% of the outstanding membership interests of Infusionz LLC.
Basis of Presentation and Principles of Consolidation
The Company’s consolidated financial statements are prepared in accordance with accounting principles generally accepted in the United States (“GAAP”). The consolidated financial statements include the accounts of all subsidiaries in which the Company holds a controlling financial interest as of the June 30, 2021 and 2020.
Note 2. Significant Accounting Policies
The significant accounting policies followed are:
Use of Estimates - The preparation of financial statements in conformity with accounting principles generally accepted in the United States of America requires management to make estimates and assumptions that affect the reported amounts of assets and liabilities and disclosure of contingent assets and liabilities at the date of the financial statements and the reported amounts of revenues and expenses during the reporting period. Actual results could differ from those estimates.
Significant estimates underlying the Company’s reported financial position and results of operations include the allowance for doubtful accounts, useful lives of property and equipment, impairment of long-lived assets, inventory valuation, fair value of stock-based compensation and valuation allowance on deferred tax assets.
| F-6 |
| Table of Contents |
Cash and Cash Equivalents - The Company considers all highly liquid debt instruments with a maturity of three months or less to be cash equivalents. Cash and cash equivalents are maintained at financial institutions and at times, balances may exceed federally insured limits. The Company has never experienced any losses related to these balances.
Accounts Receivable - The Company regularly reviews accounts receivable for any bad debts based on an analysis of the Company’s collection experience, customer credit worthiness and current economic trends. After all attempts to collect a receivable have failed, the receivable is written off against the allowance. Based on management’s review of accounts receivable, the Company recorded $57,500 and $10,000 as allowance for doubtful accounts at June 30, 2021 and 2020, respectively. The Company had bad debt expense of $78,185 and $160,740 for the years ended June 30, 2021, and 2020, respectively, including write-offs of accounts receivables $45,185 and $150,740, for the years ended June 30, 2021 and 2020, respectively.
Inventory - Inventory consists of raw materials, work-in-process and finished goods and is stated at the lower of cost or net realizable value, cost is determined by the weighted average moving cost inventory method. Net realizable value is determined, with appropriate consideration given to obsolescence, excessive levels, deterioration, and other factors.
Property and Equipment - Property and equipment is recorded at cost. Depreciation is calculated using the straight-line method over the estimated useful lives of the assets ranging from 3 to 7 years. Leasehold improvements are amortized over the shorter of their estimated useful lives of 5 years or the related lease term. Gains and losses upon disposition are reflected in the Statement of Operations in the period of disposition. Maintenance and repair expenditures are charged to expense as incurred. The Company disposed of some equipment during 2020 which resulted in a gain on the sale.
Business Combinations -The Company accounts for its business combinations using the acquisition method of accounting. The cost of an acquisition is measured as the aggregate of the acquisition date fair values of the assets transferred and liabilities assumed by the Company to the seller’s cash consideration and equity instruments issued. Transaction costs directly attributable to the acquisition are expensed as incurred. The excess of (i) the total costs of acquisition over (ii) the fair value of the identifiable net assets of the acquiree is recorded as identifiable intangible assets and goodwill.
Goodwill - The Company evaluates its goodwill for possible impairment as prescribed by ASC 350-20-35, Intangibles — Goodwill and Other (Topic 350). The Company test for Goodwill Impairment at least annually and when one or more triggering events or circumstances indicate that the goodwill might be impaired. Under this guidance, annual or interim goodwill impairment testing is performed by comparing the estimated fair value of a reporting unit with its carrying amount. An impairment charge is recognized for the amount by which the carrying amount exceeds the reporting unit’s fair value, not to exceed the carrying value of goodwill.
The Company performed its annual test as of June 30, 2021. No impairment charge was identified in connection with the annual goodwill impairment test
Impairment of Long-lived Assets - Long-lived assets are reviewed for impairment whenever events or changes in circumstances indicate that the book value of the asset may not be recoverable. The Company periodically evaluates whether events and circumstances have occurred that indicate possible impairment. When impairment indicators exist, the Company estimates the future undiscounted net cash flows of the related asset or asset group over the remaining life in measuring whether or not the asset values are recoverable. The Company did not recognize impairment on its long-lived assets during the years ended June 30, 2021 or 2020.
| F-7 |
| Table of Contents |
Revenue Recognition - The Company has adopted the new revenue recognition guidelines in accordance with ASC 606, Revenue from Contracts with Customers (ASC 606), commencing from the period under this report. The Company analyzes its contracts to assess that they are within the scope and in accordance with ASC 606. In determining the appropriate amount of revenue to be recognized as the Company fulfills its obligations under each of its agreements, whether for goods and services or licensing, the Company performs the following steps: (i) identification of the promised goods or services in the contract; (ii) determination of whether the promised goods or services are performance obligations including whether they are distinct in the context of the contract; (iii) measurement of the transaction price, including the constraint on variable consideration; (iv) allocation of the transaction price to the performance obligations based on estimated selling prices; and (v) recognition of revenue when (or as) the Company satisfies each performance obligation. The Company acts as a principal in its revenue transactions as the Company is the primary obligor in the transactions. Generally, the Company recognizes revenue for its products upon shipment to customers, provided no significant obligations remain and collection is probable.
Product Revenue - Most of the Company’s revenue contracts are from domestic sales and represent a single performance obligation related to the fulfillment of customer orders for the purchase of its products. Net sales reflect the transaction prices for these contracts based on the Company’s selling list price, which is then reduced by estimated costs for trade promotional programs, consumer incentives, and allowances and discounts used to incentivize sales growth and build brand awareness.
The Company recognizes revenue at the point in time that control of the ordered product is transferred to the customer, which is upon shipment to the customer or other customer-designated delivery point. Taxes collected from customers that are remitted to governmental agencies are accounted for on a net basis and not included as revenue.
The Company does not accept sales returns from wholesale customers, as the products are pre-approved prior to production and shipment. E-Commerce product returns must be completed within 45 days of the date of purchase. The Company does not accrue for estimated sales returns as historical sales returns have been minimal. The Company records deferred revenues when cash payments are received or due in advance of performance, including amounts which are refundable. Substantially all the deferred revenue as of June 30, 2020 was recognized as revenue in the year ended June 30, 2021.
Shipping and handling fees billed to customers are included in revenue. Shipping and handling fees associated with freight are generally included in cost of revenue.
Trade Show Revenue - A significant portion of the Company’s annual revenue is generated from the production of a single trade show. The revenue includes booth space sales, registration fees and sponsorship fees. The Company recognizes revenue upon completion of the CBD.IO trade show. Amounts invoiced prior to the completion of the trade show are recorded as deferred revenues in the consolidated balance sheets until the completion of the event. As of June 30, 2021, and 2020, the Company had no deferred revenue related to trade show business.
Loyalty Program - The Company grants customers loyalty points for each purchase on the website and at the time of the sale, accrues the estimated cost related to fulfilling the future purchase in accrued liabilities. When the points are redeemed, the Company does not recognize any revenue related to the purchase and reduces the accrued liability related to the cost of the purchase.
Advertising - The Company supports its products with advertising to build brand awareness of the Company’s various products in addition to other marketing programs executed by the Company’s marketing team. The Company believes the continual investment in advertising is critical to the development and sale of its CBD branded products. Advertising costs of $771,546 and $165,640 were expensed as incurred during the years ended June 30, 2021 and 2020, respectively.
Stock Based Compensation - The Company recognizes all share-based payments to employees, including grants of employee stock options, as compensation expense in the financial statements based on their fair values. That expense will be recognized over the period during which an employee is required to provide services in exchange for the award, known as the requisite service period (usually the vesting period) or immediately if the share-based payments vest immediately.
| F-8 |
| Table of Contents |
Non-employee Stock-based Payments - The Company’s accounting policy for equity instruments issued to consultants and vendors in exchange for goods and services follows the provisions of ASC 2018-07, which simplifies the accounting for non-employee share-based payment transactions. The amendments specify that Topic 718 applies to all share-based payment transactions in which a grantor acquires goods or services to be used or consumed in a grantor’s own operations by issuing share-based payment awards. Stock-based payments related to non-employees is accounted for based on the fair value of the related stock or options or the fair value of the services, whichever is more readily determinable. The measurement date for the fair value of the equity instruments issued is determined at the earlier of (i) the date at which a commitment for performance by the consultant or vendor is reached or (ii) the date at which the consultant or vendor’s performance is complete. In the case of equity instruments issued to consultants, the fair value of the equity instrument is recognized over the term of the consulting agreement.
Fair Value Measurements - The Company accounts for financial instruments in accordance with FASB Accounting Standards Codification (ASC) 820 “Fair value Measurement and Disclosures” (ASC 820). ASC 820 defines fair value, establishes a framework for measuring fair value and expands disclosures about fair value measurements. ASC 820 defines fair value as the exchange price that would be received for an asset or paid to transfer a liability (an exit price) in the principal or most advantageous market for the asset or liability in an orderly transaction between market participants on the measurement date. ASC 820 also establishes a fair value hierarchy that distinguishes between (1) market participant assumptions developed based on market data obtained from independent sources (observable inputs) and (2) an entity’s own assumptions about market participant assumptions developed based on the best information available in the circumstances (unobservable inputs).
The fair value hierarchy consists of three broad levels, which gives the highest priority to unadjusted quoted prices in active markets for identical assets or liabilities (Level 1) and the lowest priority to unobservable inputs (Level 3). The three levels of the fair value hierarchy are described below:
|
| • | Level 1 - Unadjusted quoted prices in active markets that are accessible at the measurement date for identical, unrestricted assets or liabilities. |
|
|
|
|
|
| • | Level 2 - Inputs other than quoted prices included within Level 1 that are observable for the asset or liability, either directly or indirectly, including quoted prices for similar assets or liabilities in active markets; quoted prices for identical or similar assets or liabilities in markets that are not active; inputs other than quoted prices that are observable for the asset or liability (e.g. interest rates); and inputs that are derived principally from or corroborated by observable market data by correlation or other means. |
|
|
|
|
|
| • | Level 3 - Inputs that are both significant to the fair value measurement and unobservable. |
The estimated fair value of certain financial instruments, including cash and cash equivalents, accounts receivable, accounts payable, accrued expenses, deferred revenue and debt are carried at historical cost basis, which approximates their fair values because of the short-term nature of these instruments.
Leases - The Company determines if a contract contains a lease at inception. US GAAP requires that the Company’s leases be evaluated and classified as operating or finance leases for financial reporting purposes. The classification evaluation begins at the commencement date and the lease term used in the evaluation includes the non-cancellable period for which the Company has the right to use the underlying asset, together with renewal option periods when the exercise of the renewal option is reasonably certain and failure to exercise such option will result in an economic penalty. All of the Company’s real estate leases are classified as operating leases.
Most real estate leases include one or more options to renew, with renewal terms that generally can extend the lease term for an additional two years. The exercise of lease renewal options is at the Company’s discretion. The Company evaluates renewal options at lease inception and on an ongoing basis and includes renewal options that it is reasonably certain to exercise in its expected lease terms when classifying leases and measuring lease liabilities. Lease agreements generally do not require material variable lease payments, residual value guarantees or restrictive covenants.
The Company’s leases generally do not provide an implicit rate, and therefore the Company uses its incremental borrowing rate as the discount rate when measuring operating lease liabilities. The incremental borrowing rate represents an estimate of the interest rate the Company would incur at lease commencement to borrow an amount equal to the lease payments on a collateralized basis over the term of a lease within a particular currency environment.
| F-9 |
| Table of Contents |
Income Taxes - Income taxes are provided for the tax effects of transactions reported in the financial statements and consist of taxes currently due plus deferred taxes resulting from temporary differences. Such temporary differences result from differences in the carrying value of assets and liabilities for tax and financial reporting purposes. The deferred tax assets and liabilities represent the future tax consequences of those differences, which will either be taxable or deductible when the assets and liabilities are recovered or settled. A valuation allowance is provided to reduce the deferred tax assets reported if based on the weight of the available positive and negative evidence, it is more likely than not some portion or all of the deferred tax assets will not be realized.
The Company identifies and evaluates uncertain tax positions, if any, and recognizes the impact of uncertain tax positions for which there is a less than more-likely-than-not probability of the position being upheld when reviewed by the relevant taxing authority. Such positions are deemed to be unrecognized tax benefits and a corresponding liability is established on the balance sheet. The Company has not recognized a liability for uncertain tax positions. If there were an unrecognized tax benefit, the Company would recognize interest accrued related to unrecognized tax benefits in interest expense and penalties in operating expenses.
The Company uses the asset and liability method of accounting for income taxes in accordance with ASC Topic 740, “Income Taxes.” Under this method, income tax expense is recognized for the amount of: (i) taxes payable or refundable for the current year and (ii) deferred tax consequences of temporary differences resulting from matters that have been recognized in an entity’s financial statements or tax returns. Deferred tax assets and liabilities are measured using enacted tax rates expected to apply to taxable income in the years in which those temporary differences are expected to be recovered or settled.
The effect on deferred tax assets and liabilities of a change in tax rates is recognized in the results of operations in the period that includes the enactment date.
ASC Topic 740 clarifies the accounting for uncertainty in income taxes recognized in an enterprise’s financial statements and prescribes a recognition threshold and measurement attribute for the financial statement recognition and measurement of a tax position taken or expected to be taken in a tax return. ASC Topic 740 provides guidance on de-recognition, classification, interest and penalties, accounting in interim periods, disclosure, and transition. There are no material uncertain tax positions at June 30, 2021.
On December 22, 2017, the U.S. government enacted the Tax Act, which made significant changes to the Internal Revenue Code of 1986, as amended, including, but not limited to, reducing the U.S. corporate statutory tax rate and the net operating loss incurred after December 31, 2017 can be carried forward indefinitely and the two year net operating loss carried back was eliminated (prohibited).
Earnings (loss) per Share - Basic earnings (loss) per share is computed by dividing net income (loss) attributable to common stockholders by the weighted average common shares outstanding for the period. Diluted income (loss) per share is computed giving effect to all potentially dilutive common shares. Potentially dilutive common shares may consist of incremental shares issuable upon the exercise of stock options and warrants and upon the conversion of notes. There were no potentially dilutive common shares for the year ended June 30, 2020. For the year ended June 30, 2021, the dilutive common shares are as follows:
|
|
| June 30, |
| |
|
|
| 2021 |
| |
|
|
|
|
| |
| Stock options |
|
| 1,697,889 |
|
| Warrants |
|
| 129,667 |
|
| Preferred stock |
|
| 500,000 |
|
| Weighted average shares outstanding |
|
| 11,930,378 |
|
| Fully diluted weighted average shares outstanding |
|
| 14,257,934 |
|
| F-10 |
| Table of Contents |
The dilutive effect of potentially dilutive securities is reflected in diluted earnings per common share by application of the treasury stock method. Under the treasury stock method, an increase in the fair market value of the Company's common stock can result in a greater dilutive effect from potentially dilutive securities.
Deferred Revenue - The Company records deposits as deferred revenue when a customer pays in advance of shipping the product. Once the product is shipped, the deposit is recorded as revenue and the related commissions are paid. All products were shipped related to deposits in deferred revenue, in less than one year.
The Company recognizes revenue upon completion of the CBD.IO trade show. Amounts invoiced prior to the completion of the trade show are recorded as deferred revenues in the consolidated balance sheets until the completion of the event.
Convertible Debt and Securities - The Company follows beneficial conversion feature guidance in ASC 470-20, which applies to convertible stock as well as convertible debt. A beneficial conversion feature is defined as a nondetachable conversion feature that is in the money at the commitment date. The beneficial conversion feature guidance requires recognition of the conversion option's in-the-money portion, the intrinsic value of the option, in equity, with an offsetting reduction to the carrying amount of the instrument. The resulting discount is amortized as interest over the life of the instrument, if a stated maturity date exists, or to the earliest conversion date, if there is no stated maturity date. If the earliest conversion date is immediately upon issuance, the expense must be recognized at inception. When there is a subsequent change to the conversion ratio based on a future occurrence, the new conversion price may trigger the recognition of an additional beneficial conversion feature on occurrence.
Non-controlling Interests in Consolidated Financial Statements - In December 2007, the FASB issued ASC 810-10-65, “Non-controlling Interests in consolidated Financial Statements”. This ASC clarifies that a non-controlling (minority) interest in subsidiaries is an ownership interest in the entity that should be reported as equity in the consolidated financial statements. It also requires consolidated net income to include the amounts attributable to both the parent and non-controlling interest, with disclosure on the face of the consolidated income statement of the amounts attributed to the parent and to the non-controlling interest. In accordance with ASC 810-10-45-21, those losses attributable to the parent and the non-controlling interest in subsidiaries may exceed their interests in the subsidiary’s equity. The excess and any further losses attributable to the parent and the non-controlling interest shall be attributed to those interests even if that attribution results in a deficit non-controlling interest balance.
Operating Segments - The Company’s financial reporting is organized into two segments: products and trade shows for revenue and cost of revenue. The Company’s internal reporting for product sales is organized into three channels of distribution: Grove, Inc. branded products, manufacturing of products to be sold under customers brands and white label products that are sold under customer brands. These product sales are aggregated and viewed by management as one reportable segment due to their similar economic characteristics, products, production, distribution processes and regulatory environment.
The Company does not allocate or track certain general and administrative expenses to individual reportable segments.
Recent Accounting Pronouncements - There are new accounting pronouncements issued by the Financial Accounting Standards Board (“FASB”) which are not yet effective as follows:
In August 2020, the FASB issued ASU 2020-06-Debt with Conversion and Other Options (Subtopic 470-20) and Derivatives and Hedging - Contracts in Entity’s Own Equity, which simplifies the guidance for certain convertible debt instruments by removing the separation models for convertible debt with a cash conversion feature or convertible instruments with a beneficial conversion feature. As a result, convertible debt instruments will be reported as a single liability instrument with no separate accounting for embedded conversion features. Additionally, ASU 2020-06 requires the application of the if-converted method for calculating diluted earnings per share and the treasury stock method will be no longer available. The provisions of ASU 2020-06 are applicable for fiscal years beginning after December 15, 2021, with early adoption permitted no earlier than fiscal years beginning after December 15, 2020. The Company expects the primary impacts of this new standard will be to increase the carrying value of its Convertible Debt and reduce its reported interest expense. In addition, the Company will be required to use the if-converted method for calculating diluted earnings per share. The Company is currently evaluating the impact the adoption of this standard will have on its condensed consolidated financial statements.
| F-11 |
| Table of Contents |
No other recent accounting pronouncements were issued by FASB and the SEC that are believed by management to have a material impact on the Company’s present or future unaudited condensed consolidated financial statements.
Note 3. Acquisition
Infusionz LLC
On July 1, 2020 the Company entered into an Agreement and Plan of Merger with Infusionz LLC (the “Infusionz Agreement”) with the Members of Infusionz LLC (“Sellers”). Pursuant to the terms of the Infusionz Agreement on July 1, 2020 the Company acquired 100% of the outstanding interest of Infusionz LLC, a Colorado corporation (“Infusionz”).
Infusionz LLC was incorporated in the state of Colorado in May 2016. The Infusionz, Inc. develops, manufactures, and markets products based on Hemp-based Cannabidiol (“CBD”) including, but not limited to edibles, tinctures, topicals, capsules and pet products, similar to the same products Grove, Inc. manufactures and markets. Infusionz Inc. will also manufacture CBD products for other businesses under their brand and specifications, similar to Grove, Inc.
Under the purchase method of accounting, the transaction was valued at an estimated fair value of $3,350,000. The estimate was based on the consideration paid or payable, consisting of $3,000,000 of equity consideration payable in the form of the Company’s common stock and cash consideration of approximately $350,000, paid based on terms of the Infusionz Agreement. The Company will issue a minimum of 833,334 shares of common stock Per the Infusionz Agreement, the number of shares of the Company’s Common Stock to be issued to the Sellers will be based on $3.60 per share; provided however, that in the event of and upon any public offering of the Company’s common stock, if the ‘offering price’ of the Company’s successful underwritten initial public offering of the Company’s Common Stock is lower than $3.60 per share (post reverse split), the Company shall promptly issue such additional shares proportionately to each of the Sellers necessary to bring the value of the equity consideration to a total of $3,000,000.
On July 1, 2020, the closing of the acquisition, the Company issued 222,223 shares of Common Stock (post-reverse split) to the Sellers, based on the most recent price of $1.53 per share of Common Stock. The Company has an accrued acquisition payable of $2,424,745 accrued for the cash and stock to be issued related to the Infusionz Agreement.
Since the closing of the acquisition, the Company has issued an additional 304,181 shares of common stock to the Sellers based on the most recent price of $1.53 per share of Common Stock. Based on this valuation, the Company will issue an additional 1,535,781 shares of Common Stock to the Sellers in equity consideration, as adjusted based on the initial public offering price, pursuant to the Infusionz Agreement as set forth below.
On November 1, 2020 the Company issued 101,389 shares of Common Stock in relations to the acquisition of Infusionz LLC. The shares were issued at a $1.53 per common share with adjustments to the final number of shares and value based on the acquisition agreement.
On January 4, 2021 the Company paid the former members of Infusionz LLC $75,000 as per the acquisition agreement.
On February 1, 2021 the Company issued 101,392 shares of Common Stock in relations to the acquisition of Infusionz LLC. The shares were issued at a $1.53 per common share with adjustments to the final number of shares and value based on the acquisition agreement.
On June 25, 2021 the Company issued 101,400 shares of Common Stock in relations to the acquisition of Infusionz LLC. The shares were issued at a $5.75 per common share with adjustments to the final number of shares and value based on the acquisition agreement.
| F-12 |
| Table of Contents |
The Company’s equity and cash consideration payment schedule pursuant to the Infusionz Agreement is as follows:
| Date |
| Cash |
|
| Shares of Common Stock |
| ||
| July 1, 2020 |
| $ | 300,000 |
|
|
| 222,223 |
|
| December 31, 2020 (paid January 4, 2021) |
|
| 75,000 |
|
|
| - |
|
| November 1, 2020 |
|
| - |
|
|
| 101,392 |
|
| February 1, 2021 |
|
| - |
|
|
| 101,392 |
|
| March 31, 2021 (paid April 2, 2021) |
| $ | 75,000 |
|
|
| - |
|
| June 1, 2021 (issued June 25, 2021) |
|
| - |
|
|
| 101,392 |
|
| September 1,2021 |
|
| - |
|
|
| 306,935 |
|
| Total Consideration |
| $ | 450,000 |
|
|
| 833,334 |
|
Acquisition payable:
| Date |
| Consideration |
| |
| Acquisition |
| $ | 3,350,000 |
|
| July 1, 2020 – cash |
|
| (200,000 | ) |
| July 1, 2020 - equity consideration (222,222 common shares of the acquirer) * |
|
| (340,000 | ) |
| November 1, 2020 - equity consideration (101,389 common shares of the acquirer) * |
|
| (155,125 | ) |
| January 4, 2021 – cash |
|
| (75,000 | ) |
| February 1, 2021 - equity consideration (101,932 common shares of the acquirer) * |
|
| (155,130 | ) |
| March 31, 2021 |
|
| (75,000 | ) |
| June 1, 2021 - equity consideration (101,400 common shares of the acquirer) |
|
| (584,869 | ) |
| Acquisition payable ** |
| $ | 1,764,876 |
|
* Stock consideration was valued at $1.53 per common share as that was the last purchase price of the stock.
** 306,945 shares of the Company’s common stock were issued on September 1, 2021, in consideration for this liability.
The assets and liabilities of Infusionz are recorded at their respective fair values as of the closing date of the Infusionz Agreement, and the following table summarizes these values based on the balance sheet at July 1, 2020, the effective closing date.
| Tangible Assets |
| $ | 778,331 |
|
| Intangible Assets |
|
| 1,920,720 |
|
| Goodwill |
|
| 1,331,429 |
|
| Liabilities Acquired |
|
| (680,480 | ) |
| Total Purchase Price |
| $ | 3,350,000 |
|
The acquisition of Infusionz LLC provided the Company with additional expertise in the industry, expanded the branded product offerings of the Company, additional manufacturing resources and improved gross margin through synergies recognized with the consolidation of the two companies manufacturing and distribution. These are the factors of the goodwill recognized in the acquisition.
| F-13 |
| Table of Contents |
Consolidated pro-forma unaudited financial statements.
The following unaudited pro forma information does not purport to present what the Company’s actual results would have been had the acquisitions occurred on July 1, 2019, nor is the financial information indicative of the results of future operations. The following table represents the unaudited consolidated pro forma results of operations for the year ended June 30, 2020, as if the acquisition occurred on July 1, 2019. Operating expenses have been increased for the amortization expense associated with the fair value adjustment of definite lived intangible assets of approximately $333,000 per year.
| Pro Forma, Unaudited |
|
|
|
|
|
|
| Proforma |
|
|
|
| ||||
| Year ended June 30, 2020 |
| Grove Inc. |
|
| Infusionz LLC |
|
| Adjustments |
|
| Proforma |
| ||||
|
|
|
|
|
|
|
|
|
|
|
|
|
| ||||
| Net sales |
| $ | 7,412,860 |
|
| $ | 3,787,495 |
|
|
|
|
| $ | 11,200,355 |
| |
| Cost of sales |
| $ | 4,842,897 |
|
| $ | 2,837,571 |
|
|
|
|
| $ | 7,680,468 |
| |
| Operating expenses |
| $ | 7,408,293 |
|
| $ | 1,279,668 |
|
| $ | 333,000 |
|
| $ | 9,020,961 |
|
| Net income (loss) |
| $ | (5,383,673 | ) |
| $ | (335,484 | ) |
| $ | (333,000 | ) |
| $ | (6,052,157 | ) |
| Basic loss per common share |
| $ | (0.53 | ) |
| $ | (0.40 | ) |
|
|
|
|
| $ | (0.55 | ) |
| Weighted average shares outstanding |
|
| 10,097,075 |
|
|
| 833,333 |
|
|
|
|
|
|
| 10,930,408 |
|
The Company’s consolidated financial statements for year ended June 30, 2021, include the actual results of Infusionz, Inc. Revenue and net income for Infusionz, Inc. included in the consolidated statement of operations for the year ended June 30, 2021, was $4,134,464 and $615,977, respectively.
Note 4. Inventory
Inventory consisted of the following:
|
|
| June 30, |
| |||||
|
|
| 2021 |
|
| 2020 |
| ||
| Raw materials |
| $ | 1,680,471 |
|
| $ | 730,000 |
|
| Finished goods |
|
| 414,481 |
|
|
| 718,448 |
|
| Total |
| $ | 2,094,952 |
|
| $ | 1,448,448 |
|
The Company writes-off the value of inventory deemed excessive or obsolete. During the year ended June 30, 2021 the Company wrote off $375,000 of inventory and during the year ended June 30, 2020, the Company did not deem that an inventory write-off was considered necessary.
Note 5. Property and Equipment
Property and equipment consist of the following:
|
|
| June 30, |
| |||||
|
|
| 2021 |
|
| 2020 |
| ||
| Furniture and fixtures |
| $ | 20,173 |
|
| $ | 4,167 |
|
| Computer equipment |
|
| 62,430 |
|
|
| 48,606 |
|
| Manufacturing equipment |
|
| 1,867,509 |
|
|
| 45,692 |
|
| Leasehold improvements |
|
| 764,225 |
|
|
| 1,787,200 |
|
| Vehicles |
|
| 98,859 |
|
|
| - |
|
| Property and equipment, gross |
|
| 2,813,196 |
|
|
| 1,885,665 |
|
| Less accumulated depreciation |
|
| (515,990 | ) |
|
| (198,392 | ) |
|
|
|
| 2,297,206 |
|
|
| 1,687,273 |
|
| Deposits on equipment |
|
| 535,194 |
|
|
| - |
|
| Property and equipment, net |
| $ | 2,832,400 |
|
| $ | 1,687,273 |
|
| F-14 |
| Table of Contents |
During the year ended June 30, 2020, the Company sold manufacturing equipment with a carrying value of approximately $289,789 for cash proceeds of $470,000 which resulting in a gain on the disposal of approximately $180,211.
During the year ended June 30, 2021, the Company sold manufacturing equipment with a carrying value of approximately $70,292 for cash proceeds of $79,000 which resulting in a gain on the disposal of approximately $8,708.
Depreciation expense for the years ended June 30, 2021, and 2020 was $303,496 and $217,868, respectively.
Note 6. Intangible Assets
As of June 30, 2021
|
|
| Cost |
|
| Accumulated Amortization |
|
| Net Book Value |
| |||
|
|
|
|
|
|
|
|
|
|
| |||
| Customer relationships |
| $ | 2,075,347 |
|
| $ | 843,636 |
|
| $ | 1,231,711 |
|
| Trade name |
|
| 845,305 |
|
|
| 270,147 |
|
|
| 575,158 |
|
| Non-compete agreements |
|
| 76,592 |
|
|
| 38,295 |
|
|
| 38,297 |
|
|
|
|
|
|
|
|
|
|
|
|
|
|
|
|
|
| $ | 2,997,244 |
|
| $ | 1,152,078 |
|
| $ | 1,845,166 |
|
As of June 30, 2020
|
|
| Cost |
|
| Accumulated Amortization |
|
| Net Book Value |
| |||
|
|
|
|
|
|
|
|
|
|
| |||
| Customer relationships |
| $ | 1,199,260 |
|
| $ | 324,467 |
|
| $ | 874,793 |
|
| Trade name |
|
| 466,555 |
|
|
| 101,088 |
|
|
| 365,467 |
|
|
|
|
|
|
|
|
|
|
|
|
|
|
|
|
|
| $ | 1,665,815 |
|
| $ | 425,555 |
|
| $ | 1,240,260 |
|
For the years ended June 30, 2021, and 2020, the Company amortized approximately $726,525 and $393,478, respectively, related to the customer list and trade name intangible assets. The customer list is being amortized on a straight-line basis over 4 years. The trade names are being amortized on a straight-line basis over 5 years.
The following intangible assets were added during the year ended June 30, 2021, from the acquisition of Infusionz LLC.
| Customer Relationships |
| $ | 876,088 |
|
| Trade Name |
|
| 378,750 |
|
| Non-compete agreements |
|
| 76,592 |
|
| Intangible Assets from Purchase |
| $ | 1,331,429 |
|
| F-15 |
| Table of Contents |
The employee contracts – non compete are being amortized on a straight-line basis over 2 years.
| Future amortization of intangible assets are as follows: |
|
|
| |
|
|
|
|
| |
| June 30, 2022 |
|
| 726,526 |
|
| June 30, 2023 |
|
| 662,913 |
|
| June 30, 2024 |
|
| 380,307 |
|
| June 30, 2025 |
|
| 75,420 |
|
|
|
| $ | 1,845,166 |
|
Note 7. Prepaid Expense and Other Current Assets
Prepaid and other assets consist of the following:
|
|
| June 30, 2021 |
|
| June 30, 2020 |
| ||
| Insurance |
| $ | 100,307 |
|
| $ | 22,304 |
|
| Prepayment to vendors |
|
| 118,283 |
|
|
| 5,000 |
|
| Deposit on services |
|
| 3,225 |
|
|
| 5,000 |
|
| Other deposits |
|
| 164,443 |
|
|
| 44,258 |
|
| Total |
| $ | 386,258 |
|
| $ | 76,562 |
|
Note 8. Operating Leases
During November 2019, the Company entered into a lease for a Nevada facility that commenced on November 13, 2019 and recorded a right of use asset and corresponding lease liability. The Company uses this leased facility for office, manufacturing, and warehouse space. The Company is responsible for real estate taxes, utilities, and repairs under the terms of certain of the operating leases. Therefore, all lease and non-lease components are combined and accounted for as single lease component. Lease expense was $227,967 and $151,978 for the years ended June 30, 2021, and 2020, respectively.
During May 2021, the Company entered into a lease for an additional Nevada facility that commenced on May 1, 2021 and recorded a right of use asset and corresponding lease liability. The Company uses this leased facility for additional warehouse space. Lease expense was $19,665 for the year ended June 30, 2021.
During July 2019, the Company entered a lease for a California facility that commenced on July 1, 2019 and recorded a right of use asset and corresponding lease liability. In March 2020, the Company consolidated operations to its Nevada facility and abandoned its manufacturing and sales facility in Costa Mesa. For the year ended June 30, 2020, the Company recorded an impairment loss of $558,918 and subsequently negotiated a settlement for this liability and recognized a gain of $387,860 in December of 2020.
During September 2020, the Company entered into a one-year lease for a Colorado facility that commenced on September 1, 2020 and recorded a right of use asset and corresponding lease liability. The Company uses this facility for office and manufacturing space. Lease expense was $62,000 for the year ended June 30, 2021.
| F-16 |
| Table of Contents |
During November 2018, the Company entered into a lease for equipment that commenced on November 1, 2018 and recorded a right of use asset and corresponding lease liability. Lease expense was $6,428 for the year ended June 30, 2021.
The Company’s weighted average remaining lease term and weighted average discount rate for operating leases as of June 30, 2021 are:
| Weighted average remaining lease term |
| 28 Months |
| |
| Weighted average incremental borrowing rate |
|
| 5.0 | % |
For the year ended June 30, 2021, the components of lease expense, included in general and administrative expenses and interest expense in the condensed consolidated statements of operations income, are as follows:
| Operating lease cost: |
|
|
| |
| Operating lease cost |
| $ | 316,060 |
|
| Amortization of ROU assets |
|
| 302,268 |
|
| Interest expense |
|
| 13,946 |
|
| Total lease cost |
| $ | 632,274 |
|
The table below reconciles the undiscounted future minimum lease payments (displayed by year and in the aggregate) under noncancelable operating leases with terms of more than one year to the total operating lease liabilities recognized in the condensed consolidated balance sheet as of June 30, 2021:
| 2022 |
| $ | 220,845 |
|
| 2023 |
|
| 118,540 |
|
| 2024 |
|
| 99,976 |
|
| Total undiscounted future minimum lease payments |
|
| 439,361 |
|
| Less: Imputed interest |
|
| (22,399 | ) |
| Present value of operating lease obligation |
| $ | 416,962 |
|
Note 9. Accrued Liabilities
Accrued liabilities consist of the following:
|
|
| June 30, |
| |||||
|
|
| 2021 |
|
| 2020 |
| ||
| Accrued expenses for loyalty program |
| $ | 24,768 |
|
| $ | 47,400 |
|
| Accrued interest |
|
| 9,817 |
|
|
| 93,543 |
|
| Accrued rent |
|
| - |
|
|
| 60,721 |
|
| Accrued state income tax |
|
| 120,776 |
|
|
| - |
|
| Other accrued liabilities |
|
| 140,660 |
|
|
| 20,000 |
|
|
|
| $ | 296,021 |
|
| $ | 221,664 |
|
Note 10. Convertible Promissory Notes and Notes Payable
During October of 2019, the Company entered into convertible promissory notes (Notes) for total proceeds of $1,500,000. The principal and interest of the Notes are payable in full at the maturity date of April 2021, if not previously converted. The Notes have an interest rate of 8%, total accrued interest is to be repaid at maturity, and are convertible into common stock if the Company enters a financing arrangement which results in the Company’s common stock becoming listed or trading. The conversion rate would be equal to the price of the Company’s common stock sold in the financing arrangement. During the year ended June 30, 2021, the Notes and related accrued interest were converted into 348,310 shares of the Company’s common stock.
| F-17 |
| Table of Contents |
On April 28, 2020, the Company entered into a Paycheck Protection Program loan for $398,945 in connection with COVID-19. The promissory note has a fixed payment schedule, commencing seven months following the funding of the note and consisting of seventeen monthly payments of principal and interest, with the principal component of each payment based upon the level of amortization of principal over a two year period from the funding date. A final payment for the unpaid principal and accrued interest will be payable no later than April 28, 2022. The note bears interest at a rate of 1.00% per annum and is deferred for the first six months of the loan. Certain portions of the loan may qualify for loan forgiveness based on the terms of the program. During the year ended June 30, 2021, the Company submitted its PPP Loan Forgiveness Application to the SBA. On June 11, 2021, the SBA confirmed that application for forgiveness had been approved and that its PPP loan, in the amount of $398,945 plus accrued interest of $4,551, had been forgiven.
On May 13, 2020, Infusionz entered a Paycheck Protection Program loan for $297,100 in connection with COVID-19. The promissory note has a fixed payment schedule, commencing seven months following the funding of the note and consisting of seventeen monthly payments of principal and interest, with the principal component of each payment based upon the level of amortization of principal over a two year period from the funding date. A final payment for the unpaid principal and accrued interest will be payable no later than May 13, 2022. The note bears interest at a rate of 1.00% per annum and is deferred for the first six months of the loan. Certain portions of the loan may qualify for loan forgiveness based on the terms of the program. The Company has not been required to make installment payments as of the date of this report and has submitted its PPP Loan Application to the SBA.
On June 3, 2020, the Company entered into a loan for $150,000 with the Small Business Administration. The promissory note has a fixed payment schedule commencing on June 3, 2021, consisting of principal and interest payments of $731 monthly. The balance of the principal and interest will payable thirty years from the date of the promissory note. The note bears interest at a rate of 3.75% per annum. The Small Business Administration has filed a UCC Financing Statement on this loan confirming it is collateralized by any and all tangible and intangible properties of the Company.
On December 7, 2020 the Company entered into a note agreement for total proceeds of $750,000 with a related party. The principal and interest of the note is payable in full in December 2022. The note bears interest at 2% and is unsecured. The Company repaid the note in full during February 2021.
In February and March 2021, the Company entered into convertible promissory notes (“Convertible Notes”) for total proceeds of $1,000,080. The term of the Convertible Notes is two years and bear interest at the rate of 8% per annum, compounded annually. The Convertible Notes and accrued interest are automatically converted into any initial public offering by the Company at a rate of seventy five percent of the initial public offering price of the shares of capital stock of the Company sold in the initial public offering. During the year ended June 30, 2021, the Convertible Notes and related accrued interest were converted into 274,330 shares of the Company’s common stock. The Company recorded interest expense of $342,813 for the beneficial conversion of the Convertible Note.
Convertible promissory notes and notes payable outstanding as of June 30, 2021 are summarized below:
|
|
| Maturity Date |
| June 30, 2021 |
| |
| 3.75% $150,000 Note Payable |
| June 2050 |
| $ | 150,000 |
|
| 1% $297,100 Note Payable |
| April 2022 |
|
| 297,100 |
|
| Total notes payable |
|
|
|
| 447,100 |
|
| Less current portion of notes payable |
|
|
|
| 447,100 |
|
| Notes payable, less current portion |
|
|
| $ | - |
|
| F-18 |
| Table of Contents |
Note 11. Related Party Transactions
For the years ended June 30, 2020, the Company leased the Las Vegas warehouse from a shareholder for $22,071 per month. This lease ended December 31, 2019, and there were no further liabilities related to this lease. The owner of the warehouse is also related to one of the members of management.
During the year ended June 30, 2021, the Company received a note from one of the members of management. The loan was $750,000, two years and has an interest rate of 2%. Management repaid the loan during the three months ended March 31, 2021.
During the year ended June 30, 2021, the Company repaid a note from one of the members of management. The loan was $12,000 and was due upon demand.
During the year ended June 30, 2021, a member of management purchased 500,000 shares of preferred stock for $50,000 cash. The Company recognized $50,000 for the beneficial conversion feature as a deemed preferred stock dividend in the Consolidated Statements of Operations. The preferred stock is convertible into the Company’s common stock at a ratio of 1.8 shares of preferred stock for a single share of the Company’s common stock at the holder’s option, has preferential liquidation rights and the preferred stock shall vote together with the common stock as a single class on all maters to which shareholders of the Company are entitled to vote at the rate of ten votes per share of preferred stock.
The above related party transactions are not necessarily indicative of the amounts and terms that would have been incurred had comparable transactions been entered into with independent parties.
Note 12. Equity Transactions
Convertible Preferred Stock
The Company’s Board of Directors has authorized 1,000,000 shares of preferred stock with a par value of $0.001 and issued 500,000 shares of preferred stock for a purchase price of $50,000. This preferred stock is convertible into shares of common stock at a ratio of 1.8 shares of preferred stock for a single share of the Company’s common stock with additional terms and conditions determined by the Board of Directors. During the year ended June 30, 2020, an investor converted 500,000 shares of preferred stock into 277,778 shares of common stock..
On February 2, 2021, the Company sold the 500,000 shares of Preferred Stock to Allan Marshall, CEO for net proceeds of $50,000. The preferred stock is convertible into the Company’s common stock at a ratio of 1.8 shares of preferred stock for a single share of the Company’s common stock at the holder’s option, has preferential liquidation rights and the preferred stock shall vote together with the common stock as a single class on all matters to which shareholders of the Company are entitled to vote at the rate of ten votes per share of preferred stock.
Common Stock
On February 8, 2021, the Shareholders consented, and the Board of Directors approved the Reverse Stock Split at the rate of 1 share of Common Stock for each 1.8 shares of Common Stock of the Company issued and outstanding (rounded up to the nearest whole number after giving effect to the Reverse Stock Split) on the Record Date of February 5, 2021.
On February 8, 2021, the Board of Directors approved the officers of the Company to file a Registration Statement on Form S-1 (the “Registration Statement”) to be prepared for the purposes of registering (i) up to $20,000,000 of Common Stock at a purchase price of no less than $4.50 per share (post reverse split), including an over-allotment option for the underwriter named therein (the “Underwriter”) to purchase additional shares of Common Stock amounting to 15% of the number of shares of Common Stock offered to the public; and (ii) a warrant to be issued to the Underwriter for the purchase of shares of Common Stock (the “Underwriter Warrant”); and (iii) the shares of Common Stock underlying the Underwriter Warrant (collectively, the “Securities”).
| F-19 |
| Table of Contents |
On June 28, 2021, and the Company completed the sale of 2,530,000 shares of Common Stock to the Underwriters, which includes 330,000 shares sold upon the full exercise of the option, for total gross proceeds of approximately $12,650,000. After deducting the underwriting commissions, discounts, and offering expenses payable by the Company, the Company received net proceeds of $10,950,315.
During the year ended June 30, 2021, the Company issued 526,404 shares of common stock for the acquisition of Infusionz. The shares were valued at $1,235,124 and the Company issued 306,935 of the Company’s stock on September 1, 2021 for the remaining acquisition liability of $1,764,876. In addition, the Company issued 83,334 shares of common stock valued at $127,500 for acquisition costs.
During the year ended June 30, 2020, the Company issued 13,072 shares of common stock for cash of $20,000. The Company also issued 277,778 shares of common stock for the exercise of an option for $400,000 of cash proceeds and forgiveness of accrued payroll of $25,000 from the investor. Finally, the Company converted preferred stock into 277,778 shares of common stock for cash proceeds of $50,000. The Company issued a total of 568,628 shares of common stock for cash consideration of $470,000 and a reduction of accrued payable of $25,000.
Trunano Labs, Inc. Common Stock
On July 1, 2020 the noncontrolling shareholders of the Company’s subsidiary, Trunano Labs Inc., converted 1,761,261 shares of Trunano Labs, Inc. stock, representing all the outstanding stock by minority interest holders, into 1,277,778 shares of the Company’s Common Stock, 10.8% of the then outstanding shares. As of July 1, 2020, Trunano Labs, Inc. is a wholly owned subsidiary of Grove Inc.
Trunano Labs, Inc. has 10,000,000 shares of common stock authorized with a par value of $0.001. As of June 30, 2020, Trunano Labs, Inc, had 7,261,261 issued and outstanding shares of common stock, of which 5,500,000 is owned by the Company. During the year ended June 30, 2019, Trunano Labs, Inc. issued 1,490,991 shares of common stock for cash proceeds of approximately $1,655,000. During the year ended June 30, 2020, Trunano Labs, Inc. issued 270,270 shares of common stock for cash proceeds of approximately $300,000. Primarily due to the decline in CBD isolate price, there were no operations during the year ended June 30, 2019 for Trunano Labs, Inc. During the year ended June 30, 2020, Trunano Labs, Inc. had a net loss of $5,850.
Note 13. Stock Based Compensation
The Company has established a Company an incentive plan, 2019 Equity Incentive Plan (the “2019 Plan”). The plan grants incentives to select persons who can make, are making and continue to make substantial contributions to the growth and success of the Company, to attract and retain the employment and services of such persons and to encourage and reward such contributions by providing these individuals with an opportunity to acquire or increase stock ownership in the Company through either the grant of options or restructured stock. The 2019 Plan is administered by the Compensation Committee or such other committee as is appointed by the Board of Directors pursuant to the 2019 Plan (the “Committee”). The Committee has full authority to administer and interpret the provisions of the 2019 Plan including, but not limited to, the authority to make all determinations with regard to the terms and conditions of an award made under the 2019 Plan. On February 8, 2021, the Shareholders consented, and the Board of Directors approved the amendment of the Stock Option Plan to increase the maximum number of Shares that may be issued thereunder by 2,777,778 Shares to 5,555,555 Shares.
The Board of Directors of the Company may from time to time, in its discretion grant to directors, officers, consultants and employees of the Company, non-transferable options to purchase common shares. The options are exercisable for a period of up to 10 years from the date of the grant.
| F-20 |
| Table of Contents |
The following table reflects the continuity of stock options for the year ended June 30, 2021:
A summary of stock option activity is as follows:
|
|
|
|
|
| Weighted |
|
| Average |
|
|
|
| ||||
|
|
|
|
|
| Average |
|
| Remaining |
|
| Aggregated |
| ||||
|
|
| Options |
|
| Exercise |
|
| Contractual |
|
| Intrinsic |
| ||||
|
|
| Outstanding |
|
| Price |
|
| Life (Years) |
|
| Value |
| ||||
| Outstanding at June 30, 2020 |
|
| 1,000,000 |
|
| $ | 1.53 |
|
|
| 8.5 |
|
| $ | - |
|
| Granted |
|
| 1,092,222 |
|
|
| 1.58 |
|
|
| 10 |
|
|
| - |
|
| Forfeited |
|
| (3,889 | ) |
|
| 3.60 |
|
|
| 10 |
|
|
| - |
|
| Outstanding at June 30, 2021 |
|
| 2,088,333 |
|
| $ | 1.55 |
|
|
| 7.49 |
|
| $ | 9,689,865 |
|
|
|
|
|
|
|
|
|
|
|
|
|
|
|
|
|
|
|
| Options exercisable at June 30, 2021 (vested) |
|
| 1,334,005 |
|
| $ | 1.55 |
|
|
| 7.89 |
|
| $ | 6,189,783 |
|
|
|
|
|
| Weighted |
|
| Average |
|
|
|
| |||||
|
|
|
|
|
| Average |
|
| Remaining |
|
| Aggregated |
| ||||
|
|
| Options |
|
| Exercise |
|
| Contractual |
|
| Intrinsic |
| ||||
|
|
| Outstanding |
|
| Price |
|
| Life (Years) |
|
| Value |
| ||||
| Outstanding at June 30, 2019 |
|
| 1,277,778 |
|
| $ | 1.53 |
|
|
| 8.5 |
|
| $ | - |
|
| Exercised |
|
| (277,778 | ) |
| $ | 1.53 |
|
|
| - |
|
|
| - |
|
| Expired |
|
| - |
|
|
| - |
|
|
| - |
|
|
| - |
|
| Forfeited |
|
| - |
|
|
| - |
|
|
| - |
|
|
| - |
|
| Outstanding at June 30, 2020 |
|
| 1,000,000 |
|
| $ | 1.53 |
|
|
| 8.5 |
|
|
| - |
|
The average fair value of stock options granted was estimated to be $1.58 per share for the period ended June 30, 2021 and the closing stock price on June 30, 2021 was $6.19 per common share.
Stock-based compensation expense attributable to stock options was approximately $611,432 and $372,770 for the years ended June 30, 2021 and 2020, respectively. As of June 30, 2021, there was approximately $688,749 unrecognized compensation expense related to unvested stock options outstanding, and the weighted average vesting period for those options was 2 years.
The value of each grant is estimated at the grant date using the Black-Scholes option model with the following assumptions for options granted during the year ended June 30, 2021. There were no options granted during the year ended June 30, 2020.
|
|
| June 30, 2021 |
| |
| Dividend rate |
|
| - |
|
| Risk free interest rate |
| 0.23%-0.87 | % | |
| Expected term |
|
| 6.5 |
|
| Expected volatility |
| 71%-72 | % | |
| Grant date stock price |
| $ | 0.85 – 2.00 |
|
| F-21 |
| Table of Contents |
The basis for the above assumptions are as follows: the dividend rate is based upon the Company’s history of dividends; the risk-free interest rate for periods within the expected term of the option is based on the U.S. Treasury yield curve in effect at the time of grant; the expected term was calculated based on the Company’s historical pattern of options granted and the period of time they are expected to be outstanding; and expected volatility was calculated based upon historical trends in Charlotte’s Web Holdings, Inc. (CWBHF) stock prices for periods prior to the date the Company’s trading information was available. Management selected Charlotte’s Web Holdings, Inc. for it length of time as a publicly trading company and the similarities of the business and industry.
Forfeitures are estimated at the time of grant and revised, if necessary, in subsequent periods if actual forfeitures differ from those estimates. Based on historical experience of forfeitures, the Company estimated forfeitures at 0% for each of the years ended June 30, 2021 and 2020, respectively.
14. Income Taxes
One Hit Wonder, Inc. has elected S Corporation status for federal income tax and California corporation business tax purposes, Steam Distribution, LLC, Havz, LLC and One Hit Wonder Holdings, LLC elected partnership status for federal income tax and California corporation business tax purposes. Under these elections, the Company is not a taxpaying entity for federal and state income tax purposes and, accordingly, no provision has been made for such income taxes, except for a minimum state corporate business tax. The stockholders’ allocable share of the Company’s income or loss is reportable on his or her income tax return through May 31, 2019. These entities under Grove, Inc. are tax paying entities and the period from June 1, 2019 to June 30, 2019 remains open and subject to examination by the Internal Revenue Service.
Cresco Management, LLC and SWCH, LLC elected partnership status for federal income tax and California and Delaware corporation business tax purposes, respectively. Under these elections, these Subsidiaries are not a taxpaying entity for federal and state income tax purposes and, accordingly, no provision has been made for such income taxes, except for a minimum state corporate business tax through December 31, 2018. The stockholders’ allocable share of the Company’s income or loss is reportable on his or her income tax return through December 31, 2018. The Company’s 2019 through 2020 tax years remain open and subject to examination by the Internal Revenue Service. Grove had no operations through December 31, 2018. On January 1, 2019 Cresco Management LLC and SWCH, LLC were contributed to Grove, Inc. in a non-taxable transaction. Grove, Inc. consolidated from 2018 to current. The first consolidated tax return for all entities was filed for the tax year December 31, 2019.
The components of the provision for income taxes are as follows:
|
|
| 2021 |
|
| 2020 |
| ||
|
|
|
|
|
|
|
| ||
| Current tax provision |
| $ | 120,776 |
|
| $ | - |
|
| Deferred tax asset valuation allowance adjustment |
|
| (1,403,594 | ) |
|
| - |
|
|
|
|
|
|
|
|
|
|
|
| Provision for income taxes (benefit) |
| $ | (1,282,815 | ) |
| $ | - |
|
The differences between income taxes calculated at the statutory U.S. federal income tax rate and the Company’s provision for income taxes are as follows:
|
|
| 2021 |
|
| 2020 |
| ||
|
|
|
|
|
|
|
| ||
| Income tax provision at statutory federal and state tax rate |
|
| 21.00 | % |
|
| 21.00 | % |
| State taxes, net of federal benefit |
|
| 5.80 | % |
|
|
|
|
| Nondeductible expense |
|
| 2.16 | % |
|
|
|
|
| Other, net |
|
| (11.52 | )% |
|
|
|
|
| Valuation allowance |
|
| (95.37 | )% |
|
| (21.00 | )% |
|
|
|
|
|
|
|
|
|
|
| Provision for income taxes |
|
| (77.93 | )% |
|
| - |
|
| F-22 |
| Table of Contents |
The net deferred income tax asset balance related to the following:
|
|
| 2021 |
|
| 2020 |
| ||
|
|
|
|
|
|
|
| ||
| Net operating losses |
| $ | 573,464 |
|
| $ | 1,282,394 |
|
| Deferred tax provision (credit) related to: |
|
|
|
|
|
|
|
|
| Reward points |
|
| 17,677 |
|
|
| 9,983 |
|
| Inventory write off |
|
| 106,275 |
|
|
| - |
|
| Adverse lease |
|
|
|
|
|
| 123,553 |
|
| Intangible assets |
|
| 245,677 |
|
|
| 58,260 |
|
| Stock Options |
|
| 278,980 |
|
|
| 78,287 |
|
| Allowance for doubtful accounts |
|
| 12,753 |
|
|
| 2,100 |
|
| Accrued compensation |
|
| 30,024 |
|
|
| 15,265 |
|
| Deferred revenue |
|
| 137,725 |
|
|
| - |
|
| Other, net |
|
| 1,015 |
|
|
| - |
|
| Valuation allowances |
|
| - |
|
|
| (1,569,836 | ) |
|
|
|
|
|
|
|
|
|
|
| Deferred tax asset |
| $ | 1,403,591 |
|
| $ | - |
|
As of June 30, 2021, there were approximately $2,730,782 of losses available to reduce federal taxable income in future years and can be carried forward indefinitely.
Future realization of the tax benefits of existing temporary differences and net operating loss carryforwards ultimately depends on the existence of sufficient taxable income within the carryforward period. As of June 30, 2021 and 2020, the Company performed an evaluation to determine whether a valuation allowance was needed. The Company considered all available evidence, both positive and negative, which included the results of operations for the current and preceding years. The Company also considered whether there was any currently available information about future years. The Company determined that it is more likely than not that the Company will have future taxable income. The Company eliminated the valuation allowance on the deferred tax asset and recognized a benefit of $1,282,815 during the year ended June 30, 2021. The eliminated of the valuation allowance was based on the historical income of the Company for the fourth quarter ended June 30, 2021, the Company’s performance and expected taxable income for the year ended June 30, 2022 and the known gain on SBA PPP loan extinguishment during the first quarter ended September 30, 2021.
We file federal and state income tax returns in jurisdictions with varying statutes of limitations. Income tax returns generally remain subject to examination by federal and most state tax authorities. We are not currently under examination in any federal or state jurisdiction.
Note 15. Risks and Uncertainties
There is substantial uncertainty and different interpretations among federal, state and local regulatory agencies, legislators, academics and businesses as to the scope of operation of Farm Bill-compliant hemp programs relative to the emerging regulation of cannabinoids. These different opinions include, but are not limited to, the regulation of cannabinoids by the U.S. Drug Enforcement Administration, or DEA, and/or the FDA and the extent to which manufacturers of products containing Farm Bill-compliant cultivators and processors may engage in interstate commerce. The uncertainties cannot be resolved without further federal, and perhaps even state-level, legislation, regulation or a definitive judicial interpretation of existing legislation and rules. If these uncertainties continue, they may have an adverse effect upon the introduction of our products in different markets.
| F-23 |
| Table of Contents |
In December 2019, a novel strain of coronavirus (COVID-19) surfaced. The spread of COVID-19 around the world in the first quarter of 2020 has caused significant volatility in U.S. and international markets. There is significant uncertainty around the breadth and duration of business disruptions related to COVID-19, as well as its impact on the U.S. and international economies and, as such, the Company is unable to predict with certainty the potential impact of COVID-19 on its business, results of operations, financial condition and cash flows.
Note 16. Segment Information
The Company provides the following segments: (a) product segment and (b) trade show segment.
| For the year ended June 30, 2021: |
|
|
|
|
|
|
|
|
| |||
|
|
|
|
|
|
|
|
|
|
| |||
|
|
| Product |
|
| Trade Show |
|
| Total |
| |||
|
|
|
|
|
|
|
|
|
|
| |||
| Revenue |
| $ | 24,095,025 |
|
| $ | - |
|
| $ | 24,095,025 |
|
| Income from operations |
| $ | 1,426,737 |
|
| $ | - |
|
| $ | 1,426,737 |
|
| Other income |
| $ | (269,396 | ) |
| $ | - |
|
| $ | (269,396 | ) |
| Depreciation expense |
| $ | 339,052 |
|
| $ | - |
|
| $ | 339,052 |
|
| Income tax expense |
| $ | - |
|
| $ | - |
|
| $ | - |
|
| Segment assets: |
|
|
|
|
|
|
|
|
|
|
|
|
| Additions to property, plant and equipment |
| $ | 1,422,129 |
|
| $ | - |
|
| $ | 1,422,129 |
|
| Total assets |
| $ | 27,254,564 |
|
| $ | - |
|
| $ | 27,254,564 |
|
| For the year ended June 30, 2020: |
|
|
|
|
|
| ||||||
|
|
|
|
|
|
|
| ||||||
|
|
| Product |
|
| Trade Show |
|
| Total |
| |||
|
|
|
|
|
|
|
|
|
|
| |||
| Revenue |
| $ | 6,159,013 |
|
| $ | 1,253,847 |
|
| $ | 7,412,860 |
|
| Loss from operations |
| $ | (5,083,154 | ) |
| $ | 244,824 |
|
| $ | (4,838,330 | ) |
| Other expense |
| $ | 546,542 |
|
| $ | - |
|
| $ | 546,542 |
|
| Depreciation expense |
| $ | 218,868 |
|
| $ | - |
|
| $ | 218,868 |
|
| Income tax expense |
| $ | - |
|
| $ | - |
|
| $ | - |
|
| Segment assets: |
|
|
|
|
|
|
|
|
|
|
|
|
| Additions to property, plant and equipment |
| $ | 1,929,028 |
|
| $ | - |
|
| $ | 1,929,028 |
|
| Total assets |
| $ | 6,402,205 |
|
| $ | - |
|
| $ | 6,402,205 |
|
Note 17. Significant Customers
The Company had significant customers during the year ended June 30, 2021 and there were no significant customers during the year ended June 30, 2020. A significant customer is defined as one that makes up ten percent or more of total revenues in a particular year or ten percent of outstanding accounts receivable balance as of the year end.
Net revenues for the year ended June 30, 2021 include revenues from significant customers in the product segment as follows:
|
|
| 2021 |
| |
| Customer A |
|
| 12 | % |
| Customer B |
|
| 15 | % |
| F-24 |
| Table of Contents |
Accounts receivable balances as of June 30, 2021, from significant customers are as follows:
|
|
| June 30, |
| |
|
|
| 2021 |
| |
| Customer A |
|
| 7 | % |
| Customer B |
|
| 30 | % |
Note 18. Subsequent Events
On August 1, 2021, the Company entered into an asset purchase agreement (VitaMedica Agreement) with Grove Acquisition Subsidiary, Inc., a Nevada corporation and wholly owned subsidiary of the Company and VitaMedica Corporation, a California corporation, David Rahm and Yvette La-Garde (Seller). VitaMedica Corporation is a leading online seller of supplements for surgery, recovery, skin, beauty, health and wellness.
Pursuant to the terms and conditions of the VitaMedica Agreement, the Company agreed to purchase substantially all of the assets of the Seller. The purchase price for the sale consists of $500,000 of Grove’s common stock, a non-negotiable promissory note from Grove in favor of the Seller in the original principal amount of $500,000, a non-negotiable convertible promissory note from Grove in favor of the Seller in the original principal amount of $500,000, convertible at $5.00 per share for a total of 100,000 shares of Grove Common Stock and a cash payment of $2,000,000.
On July 21, 2021 the Company granted stock options to purchase 1,900,000 shares of the Company’s common stock at an exercise price of $4.18 per share, with a vesting period of two years and a term of five years.
| F-25 |
| Table of Contents |
Item 9. Changes in and Disagreements with Accountants on Accounting and Financial Disclosure
There were no disagreements related to accounting principles or practices, financial statement disclosure, internal controls or auditing scope or procedure during the two fiscal years and interim periods.
Item 9A. Controls and Procedures
Management’s Report on Disclosure Controls and Procedures
Under the supervision and with the participation of our senior management, including our chief executive officer and chief financial officer, we conducted an evaluation of the effectiveness of the design and operation of our disclosure controls and procedures, as defined in Rules 13a-15(e) and 15d-15(e) under the Securities Exchange Act of 1934, as amended (the “Exchange Act”), as of the end of the period covered by this Annual Report on Form 10-K (the “Evaluation Date”). Based on this evaluation, our chief executive officer and chief financial officer concluded as of the Evaluation Date that our disclosure controls and procedures were not effective such that the information relating to us required to be disclosed in our Securities and Exchange Commission (“SEC”) reports (i) is recorded, processed, summarized and reported within the time periods specified in SEC rules and forms, and (ii) is accumulated and communicated to our management, including our chief executive officer and chief financial officer, as appropriate to allow timely decisions regarding required disclosure.
Management’s Report on Internal Control Over Financial Reporting
Management is responsible for establishing and maintaining adequate internal control over the Company’s financial reporting. In order to evaluate the effectiveness of internal control over financial reporting, as required by Section 404 of the Sarbanes-Oxley Act of 2002. Our management, with the participation of our principal executive officer and principal financial officer have conducted an assessment, including testing, using the criteria in Internal Control – Integrated Framework, issued by the Committee of Sponsoring Organizations of the Treadway Commission (“COSO”) (2013). Our system of internal control over financial reporting is designed to provide reasonable assurance regarding the reliability of financial reporting and the preparation of financial statements for external purposes in accordance with generally accepted accounting principles. Because of its inherent limitations, internal control over financial reporting may not prevent or detect misstatements. This assessment included review of the documentation of controls, evaluation of the design effectiveness of controls, testing of the operating effectiveness of controls and a conclusion on this evaluation. Based on this evaluation, management concluded that our internal control over financial reporting was not effective as of June 30, 2021. The ineffectiveness of the Company’s internal control over financial reporting was due to the following material weaknesses, which are indicative of many small companies with small staff:
| (i) | inadequate segregation of duties consistent with control objectives; and |
|
|
|
| (ii) | lack of multiple levels of supervision and review. |
| 33 |
| Table of Contents |
We are currently reviewing our disclosure controls and procedures related to these material weaknesses and expect to implement changes in the current fiscal year, including identifying specific areas within our governance, accounting and financial reporting processes to add adequate resources to potentially mitigate these material weaknesses.
Our management will continue to monitor and evaluate the effectiveness of our internal controls and procedures and our internal controls over financial reporting on an ongoing basis and is committed to taking further action and implementing additional enhancements or improvements, as necessary and as funds allow.
Because of its inherent limitations, internal controls over financial reporting may not prevent or detect misstatements. Projections of any evaluation of effectiveness to future periods are subject to the risk that controls may become inadequate because of changes in conditions, or that the degree of compliance with the policies or procedures may deteriorate. All internal control systems, no matter how well designed, have inherent limitations. Therefore, even those systems determined to be effective can provide only reasonable assurance with respect to financial statement preparation and presentation.
Management’s Remediation Plan
The weaknesses and their related risks are not uncommon in a company of our size because of the limitations in the size and number of staff. Due to our size and nature, segregation of all conflicting duties has not always been possible and may not be economically feasible.
However, we plan to take steps to enhance and improve the design of our internal control over financial reporting. During the period covered by this annual report on Form 10-K, we have not been able to remediate the material weaknesses identified above. To remediate such weaknesses, we plan to implement the following changes in the current fiscal year as resources allow:
|
| (i) | Appoint additional qualified personnel to address inadequate segregation of duties and implement modifications to our financial controls to address such inadequacies; and |
|
| (ii) | We will attempt to implement the remediation efforts set out herein by the end of the 2022 fiscal year. Because of the inherent limitations in all control systems, no evaluation of controls can provide absolute assurance that all control issues, if any, within our company have been detected. These inherent limitations include the realities that judgments in decision-making can be faulty and that breakdowns can occur because of simple error or mistake. |
Management believes that despite our material weaknesses set forth above, our financial statements for the year ended June 30, 2021 are fairly stated, in all material respects, in accordance with U.S. GAAP.
Changes in Internal Control Over Financial Reporting
There have been no changes in our internal controls over financial reporting that occurred during the year ended June 30, 2021 that have materially or are reasonably likely to materially affect, our internal controls over financial reporting.
None.
| 34 |
| Table of Contents |
Item 10. Directors, Executive Officers and Corporate Governance
All directors of our company hold office until the next annual meeting of the security holders or until their successors have been elected and qualified. The officers of our company are appointed by our board of directors and hold office until their death, resignation or removal from office. Our directors and executive officers, their ages, positions held, and duration as such, are as follows:
|
Name |
|
Position Held with the Company |
|
Age |
|
Date First Elected or Appointed |
| Allan Marshall |
| Chief Executive Officer, Chairman of the Board |
| 54 |
| May 17, 2019 |
|
|
|
|
|
|
|
|
| Robert Hackett |
| President |
| 35 |
| August 5, 2018 |
|
|
|
|
|
|
|
|
| Andrew Norstrud |
| Chief Financial Officer, Director |
| 48 |
| April 1, 2020 |
|
|
|
|
|
|
|
|
| Gene Salkind |
| Director |
| 67 |
| January 1, 2021 |
|
|
|
|
|
|
|
|
| Thomas C. Williams |
| Director |
| 61 |
| January 1, 2021 |
|
|
|
|
|
|
|
|
| Lawrence H Dugan |
| Director |
| 54 |
| January 1, 2021 |
Business Experience
The following is a brief account of the education and business experience during at least the past five years of each director, executive officer and key employee of our company, indicating the person’s principal occupation during that period, and the name and principal business of the organization in which such occupation and employment were carried out.
Allan Marshall, 54, Chief Executive Officer, Director. Mr. Marshall was retired prior to joining the Company working as a serial entrepreneur with a focus on development stage companies in hyper growth industries, with the past several years focusing on the technology and cannabis industries. Mr. Marshall is often the driving force behind the organization for its initial growth and funding strategies. Mr. Marshall began his career in the transportation and logistics industry. Mr. Marshall founded Segmentz, Inc. in November of 2000 and served as the Chief Executive Officer, successfully acquiring five distinct logistic companies, raised more than $25,000,000 of capital, creating the infrastructure and business foundation that is now XPO Logistics, Inc. (NYSE: XPO) with revenues in excess of $17 billion. Prior to Segmentz, Mr. Marshall founded U.S. Transportation Services, Inc. (“UST”) in 1995, whose main focus was third party logistics. UST was sold to Professional Transportation Group, Inc. in January 2000 and Professional Transportation Group ceased business in November 2000. Prior to 1995, Mr. Marshall served as Vice President of U.S. Traffic Ltd, a Canadian company, where he founded their United States logistics division and had previously founded a successful driver leasing company in Toronto, Ontario, Canada.
Robert Hackett, 35, President. Mr. Hackett has been actively building consumer lifestyle businesses for 15 years. In 2004, he opened a hookah lounge in Whittier, California. Prior to joining as an executive of the Company, Mr. Hackett was an equity holder, managing member and/or officer of Steam Distribution, LLC, One Hit Wonder, Inc., Havz, LLC, d/b/a Steam Wholesale, and One Hit Wonder Holdings, LLC, collectively known as “HAVZ Consolidated”, which filed voluntary petitions for relief under Chapter 11 (Chapter 11 Proceedings) of the U.S. Bankruptcy Code in the U.S. Bankruptcy Court for the District of Nevada and was subsequently acquired by the Company in 2019. By 2010 he had opened three lounges and had started a distribution business for related products to other lounges and retailers throughout California. In 2011, his firm entered into an exclusive contract to distribute a tobacco-free hookah alternative invented in Germany, called Shiazo. He retained full rights to North America. Over the next few years, as the retail footprint of customers purchasing the Shiazo product increased, Mr. Hackett’s Company added products to its distribution portfolio which could be sold into the expanding customer base. In 2014, Mr. Hackett’s Company started formulating and manufacturing its own vape liquid line, “One Hit Wonder”, which over the next two years, became a globally recognized vape eliquid brand. Over the next few years, Mr. Hackett led the development of several additional brands and more than 100 SKU’s, including the launch of cannabidiol (hemp derived CBD) products. Mr. Hackett recognized the need for a more efficient sourcing and distribution model, and the potential of building one online. He hired a team of programmers and developers and built a dropship platform that would enable vendors and buyers to seamlessly transact. CBD.io was created as a singular destination for vendors operating in the burgeoning CBD market to source, private-label, wholesale and retail. The platform design is a response to solving the issues of inefficiency and cost that he had experienced in the vape and CBD supply chain over the past several years.
| 35 |
| Table of Contents |
Andrew J. Norstrud, 47, Chief Financial Officer, Director. Mr. Norstrud joined Grove, Inc. in July of 2019 as a consultant and became the Chief Financial Officer in April of 2020 and a Director as of January, 2020. Mr. Norstrud is also the Chief Financial Officer and Director of nDivsion Inc. since January of 2019 and working with nDivsion Inc. since March of 2018. Prior to joining Grove, Inc., Mr. Norstrud served as the Chief Financial Officer for Gee Group Inc. from April 1, 2015 until June 15, 2018. Mr. Norstrud joined the Company in March 2013 as CFO and served as CEO and CFO from March 7, 2014 until April 1, 2015. Mr. Norstrud served as a director of GEE Group Inc. from March 7, 2014 until August 16, 2017. Prior to GEE Group Inc., Mr. Norstrud was a consultant with Norco Accounting and Consulting from October 2011 until March 2013. From October 2005 to October 2011, Mr. Norstrud served as the Chief Financial Officer for Jagged Peak. Prior to his role at Jagged Peak, Mr. Norstrud was the Chief Financial Officer of Segmentz, Inc. (XPO Logistics), and played an instrumental role in the company achieving its strategic goals by pursuing and attaining growth initiatives, building a financial team, completing and integrating strategic acquisitions and implementing the structure required of public companies. Previously, Mr. Norstrud worked for Grant Thornton LLP and PricewaterhouseCoopers LLP and has extensive experience with young, rapid growth public companies. Mr. Norstrud earned a BA in Business and Accounting from Western State College and a Master of Accounting with a systems emphasis from the University of Florida. Mr. Norstrud is a Florida licensed Certified Public Accountant.
Gene Salkind, 67, Director. Gene Salkind, M.D. has been a practicing neurosurgeon for greater than 35 years outside of Philadelphia, PA. He graduated from the University of Pennsylvania in 1974 with a B.A., Cum Laude, and received his medical degree from the Lewis Katz School of Medicine in 1979. He returned to the University of Pennsylvania for his neurosurgical residency and in 1985 was selected as the Chief Resident in Neurosurgery at the Hospital of the University of Pennsylvania. Since that time, he has been in a University affiliated practice of general neurological surgery. He is currently the Chief of Neurosurgery at Holy Redeemer Hospital and has also been the Chief of Neurosurgery at Albert Einstein Medical Center and Jeanes Hospital in Philadelphia. He has authored numerous peer reviewed journal articles and has given lectures throughout the country on various neurosurgical topics. He has held professorships at the University of Pennsylvania, the Allegheny Health Education and Research Foundation, and currently at the Lewis Katz School of Medicine.
Dr. Salkind is a prominent investor in the pharmaceutical arena. Past investments include Intuitive Surgical, Pharmacyclics, which grew from less than $1 per share to subsequently being acquired by Abbvie for $250 per share, and Centocor, one of the nation’s largest biotechnology companies, which was acquired by Johnson & Johnson for $4.9 billion in stock. Dr. Salkind currently sits on the boards of Cure Pharmaceuticals, a leader in the biotechnology field through its continual pursuit of redefining traditional drug delivery, and Mobiquity Technologies, Inc., a digital engagement provider. The company owns and operates a national location based mobile advertising network. The company’s suite of technologies allows clients to execute personalized and relevant experiences, driving brand awareness and incremental revenue. He was previously a board member of Derm Tech International, a global leader in non-invasive dermatological molecular diagnostics.
Dr. Salkind in 2019 joined the Strategic Advisory Board of Bio Symetrics, a company that has built data services tools for automated pre-processing, integrated analytics, and predictive modeling to make machine learning accessible to scientists and providers. Their technology serves health and hospital systems, biopharma, drug discovery and precision medicine. Dr. Salkind is and has been an employee and shareholder of Leonard A. Bruno MD/ Gene Salkind MD for the past five years. Dr. Salkind, a member of our audit committee, currently owns greater than ten percent (10%) of the outstanding voting securities of the Company.
| 36 |
| Table of Contents |
Thomas Williams, 61, has over 35 years of experience in the insurance industry. He has served in multiple roles in both originations and the administration side of operations. Mr. Williams has a specialization in providing securitization mechanisms of illiquid insurance assets. Thomas was with Smith Barney for his training on the capital markets and insurance industries.
Mr. Williams is currently an Officer and Director in several Ireland based holding companies with a focus in the insurance industry. He is an acting member of the Risk Committee of Wyndham, a large Bermuda based captive. Additionally, he has formed three insurance operations: JTRM, GIH and Arculius. Their lines of business range from Directors and Officers Liability Coverage, Life Extension Risk and Workers Compensation. He has extensive experience in the Offshore and European Union insurance markets in both developing the structure and implementing corporate governance.
Mr. Williams was the intermediary in the sale of Associate Industries of Florida, one of the largest insurance companies in Workers Compensation. He facilitated the sale to Am Trust, a New York publicly traded company in 2009.
Mr. Williams has served on the Board of two public companies:
|
| · | GEE Group, an American Stock Exchange Company from 2008 to 2018. At this company, he chaired the nominating committee and was a member of the Corporate Governance Committee and Audit Committee. |
|
|
|
|
|
| · | Two Rivers Water and Farming from 2019 to 2020. |
Mr. Williams completed a training program at Northwestern’s Kellogg Business School for Corporate Governance in Public Companies in 2013.
Lawrence H Dugan, 54, Director. Mr. Dugan is a partner with the accounting firm Dorra & Dugan and has been since 1996. Mr. Dugan graduated from the University of Central Florida in 1989. Mr. Dugan is a Florida licensed Certified Public Accountant.
Employment Agreements
On March 15, 2021, the Company entered a new employment agreement that superseded all previous agreements with Allan Marshall, Chairman and Chief Executive Officer (the “Marshall Employment Agreement”). The Marshall Employment Agreement provides for a three-year term ending on March 15, 2025, unless employment is earlier terminated in accordance with the provisions thereof and after the initial term has a standard 1-year automatic extension clause if there is no notice by the Company of termination. Mr. Marshall received a starting base salary at the rate of $460,000 per year which can be adjusted by the Compensation Committee. In the previous contract Mr. Marshall was granted an option to purchase 1,111,112 shares of Common Stock at a price of $1.53 per share with 555,556 shares vesting immediately and 555,556 shares vesting ratably over a two-year period. The options are exercisable for 10 years and provide for cashless exercise. Mr. Marshall is entitled to receive an annual bonus based on criteria to be agreed to by Mr. Marshall and the Compensation Committee. The Marshall Employment Agreement contains standard termination, change of control, non-compete and confidentiality provisions.
On July 1, 2020, the Company entered an employment agreement with Nate Weinberg, Chief Sales and Marketing Officer (the “Weinberg Employment Agreement”). The Weinberg Employment Agreement provides for a two-year term ending on July 1, 2022, unless employment is earlier terminated in accordance with the provisions thereof. Mr. Weinberg received a starting base salary at the rate of $120,000 per year which can be adjusted by the Compensation Committee and can achieve bonuses during the term of the agreement. Mr. Weinberg was granted an option to purchase 55,556 shares of Common Stock at a price of $1.53 per share vesting ratably over a two-year period. The options are exercisable for 10 years and provide for cashless exercise. The Weinberg Employment Agreement contains standard termination, change of control, non-compete and confidentiality provisions.
| 37 |
| Table of Contents |
On July 1, 2020, the Company entered an employment agreement with Joseph Reid, Director of Operations (the “Reid Employment Agreement”). The Reid Employment Agreement provides for a two-year term ending on July 1, 2022, unless employment is earlier terminated in accordance with the provisions thereof. Mr. Reid received a starting base salary at the rate of $90,000 per year which can be adjusted by the Compensation Committee and achieve bonuses during the term of the agreement. Mr. Reid was granted an option to purchase 55,556 shares of Common Stock at a price of $1.53 per share vesting ratably over a two-year period. The options are exercisable for 10 years and provide for cashless exercise. The Reid Employment Agreement contains standard termination, change of control, non-compete and confidentiality provisions.
On February 1, 2021, the Company entered an employment agreement with Andrew Norstrud, Chief Financial Officer (the “Norstrud Employment Agreement”). The Norstrud Employment Agreement provides for a three-year term ending on February 1, 2023, unless employment is earlier terminated in accordance with the provisions thereof and after the initial term has a standard 1-year automatic extension clause if there is no notice by the Company of termination. Mr. Norstrud received a starting base salary at the rate of $250,000 per year which can be adjusted by the Compensation Committee. Mr. Norstrud was granted an option to purchase 388,889 shares of Common Stock at a price of $1.53 per share vesting ratably over a two-year period. The options are exercisable for 10 years and provide for cashless exercise. Mr. Norstrud is entitled to receive an annual bonus based on criteria to be agreed to by Mr. Norstrud and the Chief Executive Officer and the Compensation Committee. The Norstrud Employment Agreement contains standard termination, change of control, non-compete and confidentiality provisions.
On May 3, 2021, the Company entered into an employment agreement with Robert Hackett, President (the “Hackett Employment Agreement”). The Hackett Employment Agreement provides for a two-year term ending on May 3, 2023, unless employment is earlier terminated in accordance with the provisions thereof. Mr. Hackett received a starting base salary at the rate of $125,000 per year which can be adjusted by the Chief Executive Officer and the Compensation Committee. Mr. Hackett is eligible to receive bonuses as determined by the Chief Executive Officer and the Compensation Committee, which may be paid in stock, stock options, or cash, within the discretion of the Chief Executive Officer and Compensation Committee. The Hackett Employment Agreement contains standard termination, change of control, non-compete and confidentiality provisions.
Family Relationships
There are no family relationships between any of our directors, executive officers and proposed directors or executive officers.
Involvement in Certain Legal Proceedings
To the best of our knowledge, none of our directors or executive officers has, during the past ten years:
|
| 1. | been convicted in a criminal proceeding or been subject to a pending criminal proceeding (excluding traffic violations and other minor offences); |
|
|
|
|
|
| 2. | had any bankruptcy petition filed by or against the business or property of the person, or of any partnership, corporation or business association of which he was a general partner or executive officer, either at the time of the bankruptcy filing or within two years prior to that time, other than the filings of voluntary petitions for relief under Chapter 11 (Chapter 11 Proceedings) of the U.S. Bankruptcy Code in the U.S. Bankruptcy Court for the District of Nevada by Steam Distribution, LLC, One Hit Wonder, Inc., Havz, LLC, d/b/a Steam Wholesale, and One Hit Wonder Holdings, LLC, of which Mr. Robert Hackett was an equity holder, managing member and/or officer; |
|
|
|
|
|
| 3. | been subject to any order, judgment, or decree, not subsequently reversed, suspended or vacated, of any court of competent jurisdiction or federal or state authority, permanently or temporarily enjoining, barring, suspending or otherwise limiting, his involvement in any type of business, securities, futures, commodities, investment, banking, savings and loan, or insurance activities, or to be associated with persons engaged in any such activity; |
|
|
|
|
|
| 4.
| been found by a court of competent jurisdiction in a civil action or by the SEC or the Commodity Futures Trading Commission to have violated a federal or state securities or commodities law, and the judgment has not been reversed, suspended, or vacated; |
|
|
|
|
|
| 5.
| been the subject of, or a party to, any federal or state judicial or administrative order, judgment, decree, or finding, not subsequently reversed, suspended or vacated (not including any settlement of a civil proceeding among private litigants), relating to an alleged violation of any federal or state securities or commodities law or regulation, any law or regulation respecting financial institutions or insurance companies including, but not limited to, a temporary or permanent injunction, order of disgorgement or restitution, civil money penalty or temporary or permanent cease-and-desist order, or removal or prohibition order, or any law or regulation prohibiting mail or wire fraud or fraud in connection with any business entity; or |
|
|
|
|
|
| 6.
| been the subject of, or a party to, any sanction or order, not subsequently reversed, suspended or vacated, of any self-regulatory organization (as defined in Section 3(a)(26) of the Exchange Act (15 U.S.C. 78c(a)(26)), any registered entity (as defined in Section 1(a)(29) of the Commodity Exchange Act (7 U.S.C. 1(a)(29)), or any equivalent exchange, association, entity or organization that has disciplinary authority over its members or persons associated with a member. |
| 38 |
| Table of Contents |
Code of Business Conduct and Ethics
The Company has adopted a Code of Business Conduct and Ethics which is filed as Exhibit 14.1 of Form S1 as filed with the SEC on May 21, 2021.
Whistleblower Policy
The Company has adopted a Whistleblower Policy which is filed as Exhibit 14.2 of Form S1 as filed with the SEC on May 21, 2021.
Limitations on Liabilities and Indemnification of Directors and Officers
For information concerning limitations of liability and indemnification and advancement rights applicable to our directors and officers, see “Description of Capital Stock-Limitations on Liability, Indemnification of Directors and Officers, and Insurance.”
Term of Office of Directors
Our directors are elected at each annual meeting of stockholders and serve until the next annual meeting of stockholders or until their successor has been duly elected and qualified, or until their earlier death, resignation or removal.
Audit Committee and Financial Expert
On January 27, 2021, our Board established an audit committee that operates under a written charter as approved by our Board. The members of our audit committee are Dr. Gene Salkind, Mr. Thomas Williams, and Mr. Lawrence Dugan. Mr. Dugan serves as chairman of the audit committee and our Board has determined that he is an “audit committee financial expert” as defined by applicable SEC rules. The Board has determined that Dr. Salkind, Mr. Williams and Mr. Dugan are independent directors as that term is defined in Rule 5605(a)(2) of the Nasdaq Listing Rules, and has determined that Dr. Salkind, Mr. Williams and Mr. Dugan as audit committee members meet the more stringent requirements under Rule 5605(c)(2) of the Nasdaq Listing Rules.
Our audit committee is responsible for: (1) the integrity of the Company's financial statements, (2) the effectiveness of the Company's internal control over financial reporting, (3) the Company's compliance with legal and regulatory requirements, (4) the independent registered public accounting firm's qualifications and independence, (5) and the performance of the Company's independent registered public accountants and (6) preparation of the audit committee report as required to be included in the Company’s annual proxy statement. The Audit Committee Charter is filed as Exhibit 10.8 of Form S1 as filed with the SEC on May 21, 2021.
| 39 |
| Table of Contents |
Compensation Committee
On January 27, 2021, our Board established a compensation committee that operates under a written charter as approved by our Board. The members of our compensation committee are Dr. Gene Salkind, Mr. Thomas Williams, and Mr. Lawrence Dugan. Dr. Salkind serves as chairman of the compensation committee.
Our compensation committee is responsible for the oversight of, and the annual and ongoing review of, the Chief Executive Officer, the compensation of the senior management team, and the bonus programs in place for employees, which includes: (1) reviewing the performance of the Chief Executive Officer and other senior officers, and determining the bonus entitlement for such officer or officers on an annual basis, (2) determining and approving proposed annual compensation and incentive opportunity level of executive officers for each fiscal year, and recommending such compensation to the Board, (3) administration of determination of proposed grants of stock options to directors, employees, consultants and advisors with the Chief Executive Officer, (4) reviewing and recommending to the Board the compensation of the Board and committee members, (5) administering and approving any general benefit plans in place for employees , ( 6 ) engaging and setting the compensation for independent counsel and other advisors and consultants, ( 7 ) preparing any reports on director and officer compensation to be included in the Company’s proxy statements , (8) assessing the Company’s competitive positions for each component of officer compensation and making recommendations to the Board regarding such positions and (9) reviewing and assessing the adequacy of its charter and submitting any recommended changes to our Board for its consideration and approval. The Compensation Committee Charter is filed as Exhibit 10.9 hereto.
Nomination and Governance Committee
On January 27, 2021, our Board established a nomination and governance committee that operates under a written charter as approved by our Board. The members of our compensation committee are Dr. Gene Salkind, Mr. Thomas Williams, and Mr. Lawrence Dugan. Mr. Williams serves as chairman of the nomination and governance committee.
Our nomination and corporate governance committee is responsible for assisting the Board in (1) proposing a slate of qualified nominees for election to the Board by the shareholders or in the event of a Board vacancy, (2) evaluating the suitability of potential nominees for membership on the Board, (3) determining the composition of the Board and its committees, (4) monitoring a process to assess Board, committee and management effectiveness, (5) aiding and monitoring management succession planning and (6) developing, recommending to the Board, implementing and monitoring policies and processes related to the Company’s corporate governance guidelines. The Nominating Committee Charter is filed as Exhibit 10.10 of Form S1 as filed with the SEC on May 21, 2021.
Nominations to the Board of Directors
We do not have any defined policy or procedural requirements for shareholders to submit recommendations or nominations for directors. Our Board believes that, given the stage of our development, a specific nominating policy would be premature and of little assistance until our business operations develop to a more advanced level. We do not currently have any specific or minimum criteria for the election of nominees to the Board. The Board, with the help of its nomination and corporate governance committee, will assess all candidates, whether submitted by management or shareholders, and make recommendations for election or appointment.
| 40 |
| Table of Contents |
Stockholder Communications
We do not have a formal policy regarding stockholder communications with our Board. A shareholder who wishes to communicate with our Board may do so by directing a written request addressed to our Chief Executive Officer, at the address appearing on the first page of this filing.
Item 11. Executive Compensation
The particulars of the compensation paid to the following persons:
|
| (a) | our principal executive officers; |
SUMMARY COMPENSATION TABLE
| Name and Principal Position |
| Year |
| Salary ($) |
|
| Bonus ($) |
|
| Stock Awards ($) |
|
| Option Awards ($)(4) |
|
| Non-Equity Incentive Plan Compensation ($) |
|
| Change in Pension Value and Nonqualified Deferred Compensation Earnings ($) |
|
| All Other Compensation ($) |
|
| Total ($) |
| ||||||||
| Allan Marshall, CEO, and Director |
| 2021 |
|
| 284,615 |
|
|
| 741,910 |
|
|
| - |
|
|
| - |
|
|
| - |
|
|
| - |
|
|
| - |
|
|
| 1,026,525 | (1) |
|
|
| 2020 |
|
| 300,000 |
|
|
| - |
|
|
| - |
|
|
| 1,325,600 |
|
|
| - |
|
|
| - |
|
|
| - |
|
|
| 1,625,600 | (2) |
|
|
|
|
|
|
|
|
|
|
|
|
|
|
|
|
|
|
|
|
|
|
|
|
|
|
|
|
|
|
|
|
| |||
| Andrew Norstrud, Chief Financial Officer |
| 2021 |
|
| 210,000 |
|
|
| 50,000 |
|
|
| - |
|
|
| 344,900 |
|
| - |
|
|
| - |
|
| - |
|
|
| 644,900 |
| ||
|
|
| 2020 |
|
| 184,230 |
|
|
| - |
|
|
| - |
|
|
| 198,840 |
|
|
|
|
|
|
|
|
|
|
|
|
|
| 383,070 | (3) | |
|
|
|
|
|
|
|
|
|
|
|
|
|
|
|
|
|
|
|
|
|
|
|
|
|
|
|
|
|
|
|
|
|
|
|
|
| Robert Hackett, President |
| 2021 |
|
| 125,000 |
|
|
| 50,000 |
|
|
|
|
|
|
|
|
|
|
|
|
|
|
|
|
|
|
|
|
|
|
| 175,000 |
|
|
|
| 2020 |
|
| 130,913 |
|
|
| - |
|
|
| - |
|
|
|
|
|
|
| - |
|
|
| - |
|
|
| - |
|
|
| 130,913 |
|
| 41 |
| Table of Contents |
There are no arrangements or plans in which we provide pension, retirement or similar benefits for directors or executive officers. Our directors and executive officers may receive share options at the discretion of our board of directors in the future. We do not have any material bonus or profit-sharing plans pursuant to which cash or non-cash compensation is or may be paid to our directors or executive officers, except that share options may be granted at the discretion of our board of directors. The value of the option awards is based on the intrinsic value at date of grant.
|
| (1) | At June 30, 2021 Allan Marshall had an accrual of $486,200 for 2021 bonus that was subsequently paid in August of 2021. |
|
| (2) | At June 30, 2020 Allan Marshall had an accrual of $72,692 of earned compensation that had not been paid. |
|
| (3) | For the fiscal year 2020, Andrew Norstrud received compensation through a consulting contract $175,000 and at June 30, 2020 there was an accrual of $7,500 owed to Andrew Norstrud for compensation. |
|
| (4) | Represents equity-based compensation expense calculated in accordance with the provisions of Accounting Standards Codification Section 718 – Compensation – Stock Compensation, using the Black-Scholes option pricing model as set forth in Notes to our consolidated financial statements in Item 13. |
Outstanding Equity Awards at Fiscal Year- End Table
The following table summarizes equity awards granted to Named Executive Officers and directors that were outstanding as of June 30, 2021:
|
|
| Option Awards |
| Stock Awards | |||||||||||||||||||||
| Name |
| Number of Securities Underlying Unexercised Options: # Exercisable |
|
| Number of Securities Underlying Unexercised Options: # Unexercisable |
|
| Equity Incentive Plan Awards: Number of Securities Underlying Unearned and Unexercisable Options: |
| Option Exercise Price $ |
|
| Option Expiration Date |
| # of Shares or Units of Stock That Have Not Vested # |
| Market Value of Shares or Units of Stock That Have Not Vested $ |
| Equity Incentive Plan Awards: Number of Unearned Shares, Units or Other Rights That Have Not Vested # |
| Equity Incentive Plan Awards: Market of Payout Value of Unearned Shares, Units or Other Rights That Have Not Vested $ | ||||
|
|
|
|
|
|
|
|
|
|
|
|
|
|
|
|
|
|
|
|
|
|
| ||||
| Allan Marshall, CEO, and Director |
|
| 787,037 |
|
|
| 46,296 |
|
|
|
| $ | 1.53 |
|
| 6/1/2029 |
|
|
|
|
|
|
|
| |
| Andrew Norstrud, Chief |
|
| 152,778 |
|
|
| 13,889 |
|
|
|
| $ | 1.53 |
|
| 6/1/2029 |
|
|
|
|
|
|
|
| |
| Financial Officer and Director |
|
| 32,047 |
|
|
| 356,481 |
|
|
|
| $ | 1.53 |
|
| 1/1/2031 |
|
|
|
|
|
|
|
| |
| Robert Hackett, President |
|
|
|
|
|
|
|
|
|
|
|
|
|
|
|
|
|
|
|
|
|
|
|
| |
| Gene Salkind, Director |
|
| 4,630 |
|
|
| 23,148 |
|
|
|
| $ | 1.53 |
|
| 2/1/2031 |
|
|
|
|
|
|
|
| |
| Tomas C. Williams, Director |
|
| 4,630 |
|
|
| 23,148 |
|
|
|
| $ | 1.53 |
|
| 2/1/2031 |
|
|
|
|
|
|
|
| |
| Lawrence H Dugan, Director |
|
| 4,630 |
|
|
| 23,148 |
|
|
|
| $ | 1.53 |
|
| 2/1/2031 |
|
|
|
|
|
|
|
| |
| 42 |
| Table of Contents |
Option Exercises and Stock Vested
In October 2019, Allan Marshall exercised an option to purchase 277,778 shares of Common Stock at a $1.53 per common share. The Company received $400,000 of cash and was relieved of $25,000 in payables to Allan Marshall for the shares of Common Stock.
Compensation of Directors
We do not have any agreements for compensating our directors for their services in their capacity as directors, although such directors are expected in the future to receive stock options to purchase shares of our Common Stock as awarded by our board of directors.
Pension, Retirement or Similar Benefit Plans
There are no arrangements or plans in which we provide pension, retirement or similar benefits for directors or executive officers. We have no material bonus or profit-sharing plans pursuant to which cash or non-cash compensation is or may be paid to our directors or executive officers, except that stock options may be granted at the discretion of the board of directors or a committee thereof.
Indebtedness of Directors, Senior Officers, Executive Officers and Other Management
None of our directors or executive officers or any associate or affiliate of our company during the last two fiscal years, is or has been indebted to our company by way of guarantee, support agreement, letter of credit or other similar agreement or understanding currently outstanding.
SECURITY OWNERSHIP OF CERTAIN BENEFICIAL OWNERS AND MANAGEMENT
The following table sets forth the ownership, as of September 27, 2021, of our Common Stock by each of our directors, by all of our executive officers and directors as a group and by each person known to us who is the beneficial owner of more than 5% of any class of our securities. As of September 27, 2021, there were 15,711,339 shares of our Common Stock issued and outstanding. All persons named have sole or shared voting and investment control with respect to the shares, except as otherwise noted. The number of shares described below includes shares which the beneficial owner described has the right to acquire within 60 days of the date of the prospectus. Unless otherwise indicated, the address for each beneficial owner is c/o Grove, Inc., 1710 Whitney Mesa Drive, Henderson, NV 89014.
| 43 |
| Table of Contents |
| Name and Address of Beneficial Owner |
| Amount and Nature of Beneficial Ownership |
|
| Percentage of Class(1) |
| ||
| Allan Marshall |
|
| 4,082,001 | (2) |
|
| 25.98 | % |
| Gene Salkind |
|
| 2,384,532 | (3) |
|
| 15.18 | % |
| Robert Hackett |
|
| 1,444,444 | (4) |
|
| 9.19 | % |
| Andrew Norstrud |
|
| 724,460 | (5) |
|
| 4.61 | % |
| Lawrence Dugan |
|
| 59,369 | (6) |
| * | % | |
| Thomas Williams |
|
| 31,591 | (7) |
| * | % | |
| Directors and Executive Officers as a Group |
|
| 8,726,397 |
|
|
| 55.54 | % |
|
|
|
|
|
|
|
|
|
|
| 5% or more Stockholders |
|
|
|
|
|
|
|
|
| Jeffrey Bishop |
|
| 1,132,443 |
|
|
| 7.21 | % |
__________
| * | Represents less than 1% of the number of shares of our Common Stock outstanding |
|
(1) |
Under Rule 13d-3, a beneficial owner of a security includes any person who, directly or indirectly, through any contract, arrangement, understanding, relationship, or otherwise has or shares: (i) voting power, which includes the power to vote, or to direct the voting of shares; and (ii) investment power, which includes the power to dispose or direct the disposition of shares. Certain shares may be deemed to be beneficially owned by more than one person (if, for example, persons share the power to vote or the power to dispose of the shares). In addition, shares are deemed to be beneficially owned by a person if the person has the right to acquire the shares (for example, upon exercise of an option) within 60 days of the date as of which the information is provided. In computing the percentage ownership of any person, the amount of shares outstanding is deemed to include the number of shares beneficially owned by such person (and only such person) by reason of these acquisition rights. As a result, the percentage of outstanding shares of any person as shown in this table does not necessarily reflect the person’s actual ownership or voting power with respect to the number of shares of Common Stock actually outstanding on September 27, 2021. As of September 27, 2021, there were 15,711,339 shares of our company’s Common Stock issued and outstanding. |
|
(2) |
Represents (i) 2,527,778 shares of Common Stock, (ii) 1,054,223 shares issuable upon the exercise of stock options that are exercisable within 60 days, (iii) 277,778 shares issuable upon the conversion of preferred stock. Does not include 1,029,110 shares issuable upon vesting and exercise of remaining stock option. |
|
(3) |
Represents (i) 2,352,941 shares of Common Stock and (ii) 31,591 shares issuable upon the exercise of stock option that are exercisable within 60 days. Does not include 46,187 shares issuable upon vesting and exercise of remaining stock option. |
|
(4) |
Represents 1,444,444 shares of Common Stock. |
|
(5) |
Represents (i) 305,556 shares of Common Stock and (ii) 418,904 shares issuable upon the exercise of stock options that are exercisable within 60 days. Does not include 336,652 shares issuable upon vesting and exercise of remaining stock options. |
|
(6) |
Represents (i)27,778 shares of Common Stock and (ii) 31,591 shares issuable upon the exercise of stock option that are exercisable within 60 days. Does not include 46,187 shares issuable upon vesting and exercise of remaining stock option. |
|
(7) |
Represents 31,591 shares issuable upon the exercise of stock option that are exercisable within 60 days. Does not include 46,187 shares issuable upon vesting and exercise of remaining stock option. |
| 44 |
| Table of Contents |
Item 13. Certain Relationships and Related Transactions, and Director Independence
Except as disclosed herein, no director, executive officer, shareholder holding at least 5% of shares of our Common Stock, or any family member thereof, had any material interest, direct or indirect, in any transaction, or proposed transaction during the year ended June 30, 2021, in which the amount involved in the transaction exceeded or exceeds the lesser of $120,000 or one percent of the average of our total assets at the year-end for the last three completed fiscal years.
Director Independence
The Board of Directors has determined that Gene Salkind, Lawrence Dugan and Thomas Williams are independent directors under the listing standards. Gene Salkind owns greater than ten percent (10%) of the voting securities of the Company.
Item 14. Principal Accounting Fees and Services
The aggregate fees billed for the most recently completed fiscal year ended June 30, 2021 and 2020 for professional services rendered by the principal accountant for the audit of our annual financial statements and review of the financial statements and services that are normally provided by the accountant in connection with statutory and regulatory filings or engagements for these fiscal periods were as follows:
|
|
| Year Ended |
| |||||
|
|
| June 30, 2021 |
|
| June 30, 2020 |
| ||
| Audit Fees |
| $ | 114,000 |
|
| $ | 112,400 |
|
| Audit Related Fees |
|
|
|
|
|
|
|
|
| Tax Fees |
|
| 63,981 |
|
|
| 41,500 |
|
| All Other Fees |
|
|
|
|
|
|
|
|
| Total |
| $ | 177,981 |
|
| $ | 153,900 |
|
Our Board of Directors pre-approves all services provided by our independent auditors. All of the above services and fees were reviewed and approved by the Board of Directors either before or after the respective services were rendered.
Our Board of Directors has considered the nature and amount of fees billed by our independent auditors and believes that the provision of services for activities unrelated to the audit is compatible with maintaining our independent auditors’ independence.
| 45 |
| Table of Contents |
Item 15. Exhibits, Financial Statement Schedules
|
| (a) | Financial Statements |
|
| (1) | Financial statements for our company are listed in the index under Item 8 of this document. |
|
|
|
|
|
| (2) | All financial statement schedules are omitted because they are not applicable, not material or the required information is shown in the financial statements or notes thereto. |
|
| (b) | Exhibits |
_______
* As filed with the SEC Form S1 on May 21, 2021
| 46 |
| Table of Contents |
SIGNATURES
Pursuant to the requirements of Section 13 or 15(d) of the Securities Exchange Act of 1934, the registrant has duly caused this report to be signed on its behalf by the undersigned, thereto duly authorized.
|
|
| GROVE INC. |
|
|
|
| (Registrant) |
|
|
|
|
|
|
| Dated: September 28, 2021 |
| /s/ Allan Marshall |
|
|
|
| Allan Marshall |
|
|
|
| President, Chief Executive Officer and Director |
|
|
|
| (Principal Executive Officer) |
|
|
|
|
|
|
| Dated: September 28, 2021 |
| /s/ Andrew J. Norstrud |
|
|
|
| Andrew J. Norstrud |
|
|
|
| Chief Financial Officer |
|
|
|
| (Principal Financial Officer and Principal Accounting Officer) |
|
Pursuant to the requirements of the Securities Exchange Act of 1934, this report has been signed below by the following persons on behalf of the registrant and in the capacities and on the dates indicated.
| Dated: September 28, 2021 |
| /s/ Allan Marshall |
|
|
|
| Allan Marshall |
|
|
|
| President, Chief Executive Officer and Director |
|
|
|
| (Principal Executive Officer) |
|
|
|
|
|
|
| Dated: September 28, 2021 |
| /s/ Andrew J. Norstrud |
|
|
|
| Andrew J. Norstrud |
|
|
|
| Chief Financial Officer |
|
|
|
| (Principal Financial Officer and Principal Accounting Officer) |
|
|
|
|
|
|
| Dated: September 28, 2021 |
| /s/ Robert Hackett |
|
|
|
| Robert Hackett |
|
|
|
| President |
|
|
|
|
|
|
| Dated: September 28, 2021 |
| /s/ Gene Salkind |
|
|
|
| Gene Salkind |
|
|
|
| Director |
|
|
|
|
|
|
| Dated: September 28, 2021 |
| /s/ Thomas C. Williams |
|
|
|
| Thomas C. Williams |
|
|
|
| Director |
|
|
|
|
|
|
| Dated: September 28, 2021 |
| /s/ Laurence H. Dugan |
|
|
|
| Laurence H. Dugan |
|
|
|
| Director |
|
| 47 |